Author: phineas

Cost Sankey Diagrams show Added Value

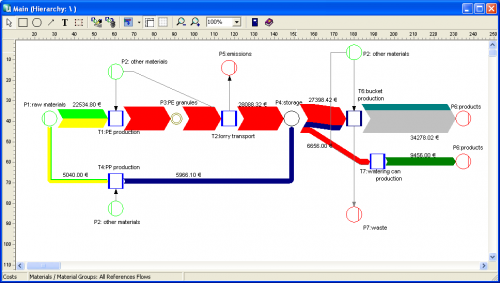
While browsing through some of my older bookmarks I discovered this page of what seems to be an information portal of one of a German federal ministry. The Sankey diagram for cost flows they show reminded me of a feature in the Umberto material flow management software, which I always wanted to inspect in more detail.

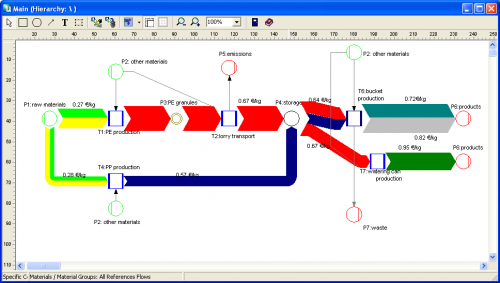
Using their 30-day trial version I worked with one of the simple demo examples they provide. Basically this software is a modeling tool for process systems and analysis of material flows within any kind of process system (production plant, supply chain, region, …). Sankey diagrams in Umberto are not the default view for material flows, but one can switch from the normal “Material Flow Network” view to the Sankey view.

Even though the Sankey diagram feature of the software would need some retouching, I was surprised and extremely pleased to see a “Cost Sankey” feature.

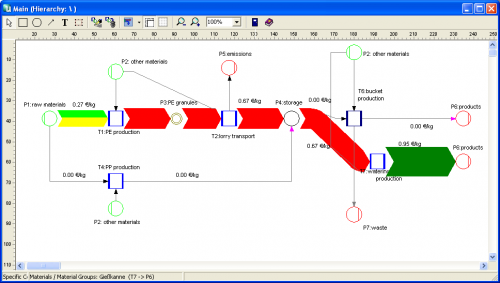
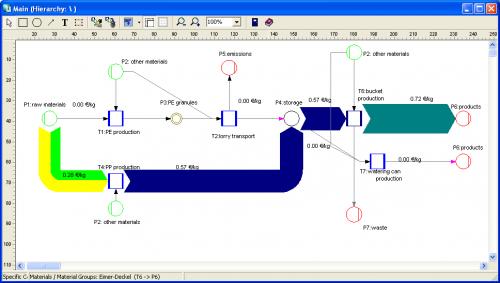
You can enter material direct cost for all materials (in the ‘bucket factory’ example of the demo all materials already have a “market price” property), as well as fixed and variable process costs. The variable process costs are spread over the process throughput using ‘machine hours’ or ‘work hours’ as cost drivers (i.e. to link cost creation to the material throughput). Thus, at every process (shown with blue squares in the flow diagram) the costs -or should I say: the value – increases. Going from left to right along the general flow direction in the Sankey diagram you can see clearly that the growing magnitude of the Sankey cost flows… a kind of ‘Value Added Sankey diagram’.


The above screenshots show the overall cost for the three products produced in the bucket factory (Fig.1), the cost per unit for each of the three products of the bucket factory (Fig.2).

The following two cost flow Sankey diagrams are for the individual costing units ‘plastic bucket’ and ‘watering can’ (Fig.3 and 4). Please note that on theses diagrams a part of the machines is not being used, so they don’t add any process costs to the costing unit (or don’t contribute to the value added). Unfortunately you can only display either mass or energy flows in one Sankey diagram, so the energy costs (from the circle labeled ‘other materials’) are not shown as a Sankey flow, even though they add to the price for each product.
Incoming and outgoing cargo @ Rotterdam Port

Last weekend I had the possibility to visit a friend in the Netherlands, and we took a tour of Rotterdam Port. Despite the bad weather, I was fascinated by the huge container ships, the cranes, the noises….

Back home I did some research and came up with the cargo data for the year 2005 from the Port of Rotterdam website.

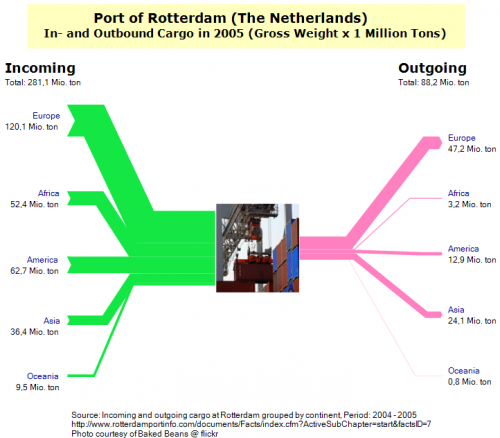
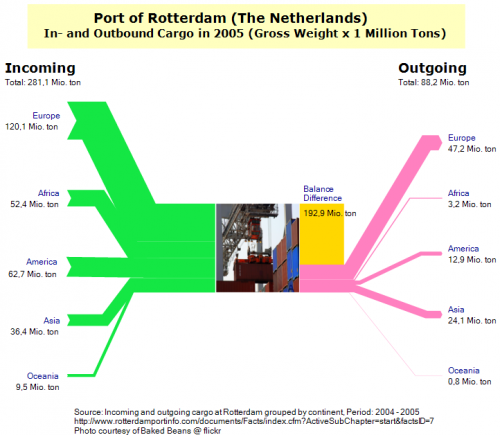
I did the following three Sankey diagrams. The first shows the inbound cargo quantities (in million tons gross weight of cargo) from the left, and the outbound quantities to the right, broken down to world regions. One can clearly see that Rotterdam handles mainly imports, with more than 281 million tons of cargo being unloaded, while only 88,2 million tons of cargo are being loaded onto ships.

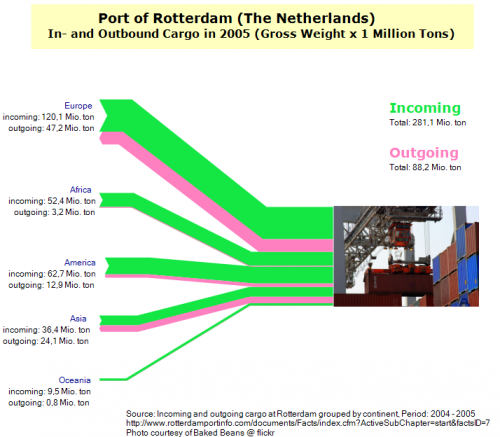
Next I flipped inbound and outbound flows to the same side. However, I think that by this the diagram loses somehow, also because some purple flows (outbound to Africa and Oceania) are too thin.

In the third version, I added a shape for the balance difference between inbound and outgoing goods.

Tell me what you think about theses Sankey diagrams. It would be interesting to compare Rotterdam to other ports. Shanghai, for example, might have the opposite picture with much more exports, but I haven’t found any data yet to show this. And, if we are talking cargo traffic: how about doing a passenger Sankey diagram for one of the international airports in the U.S. (by origin/destination continent?, by airline?)

The first Sankey diagram

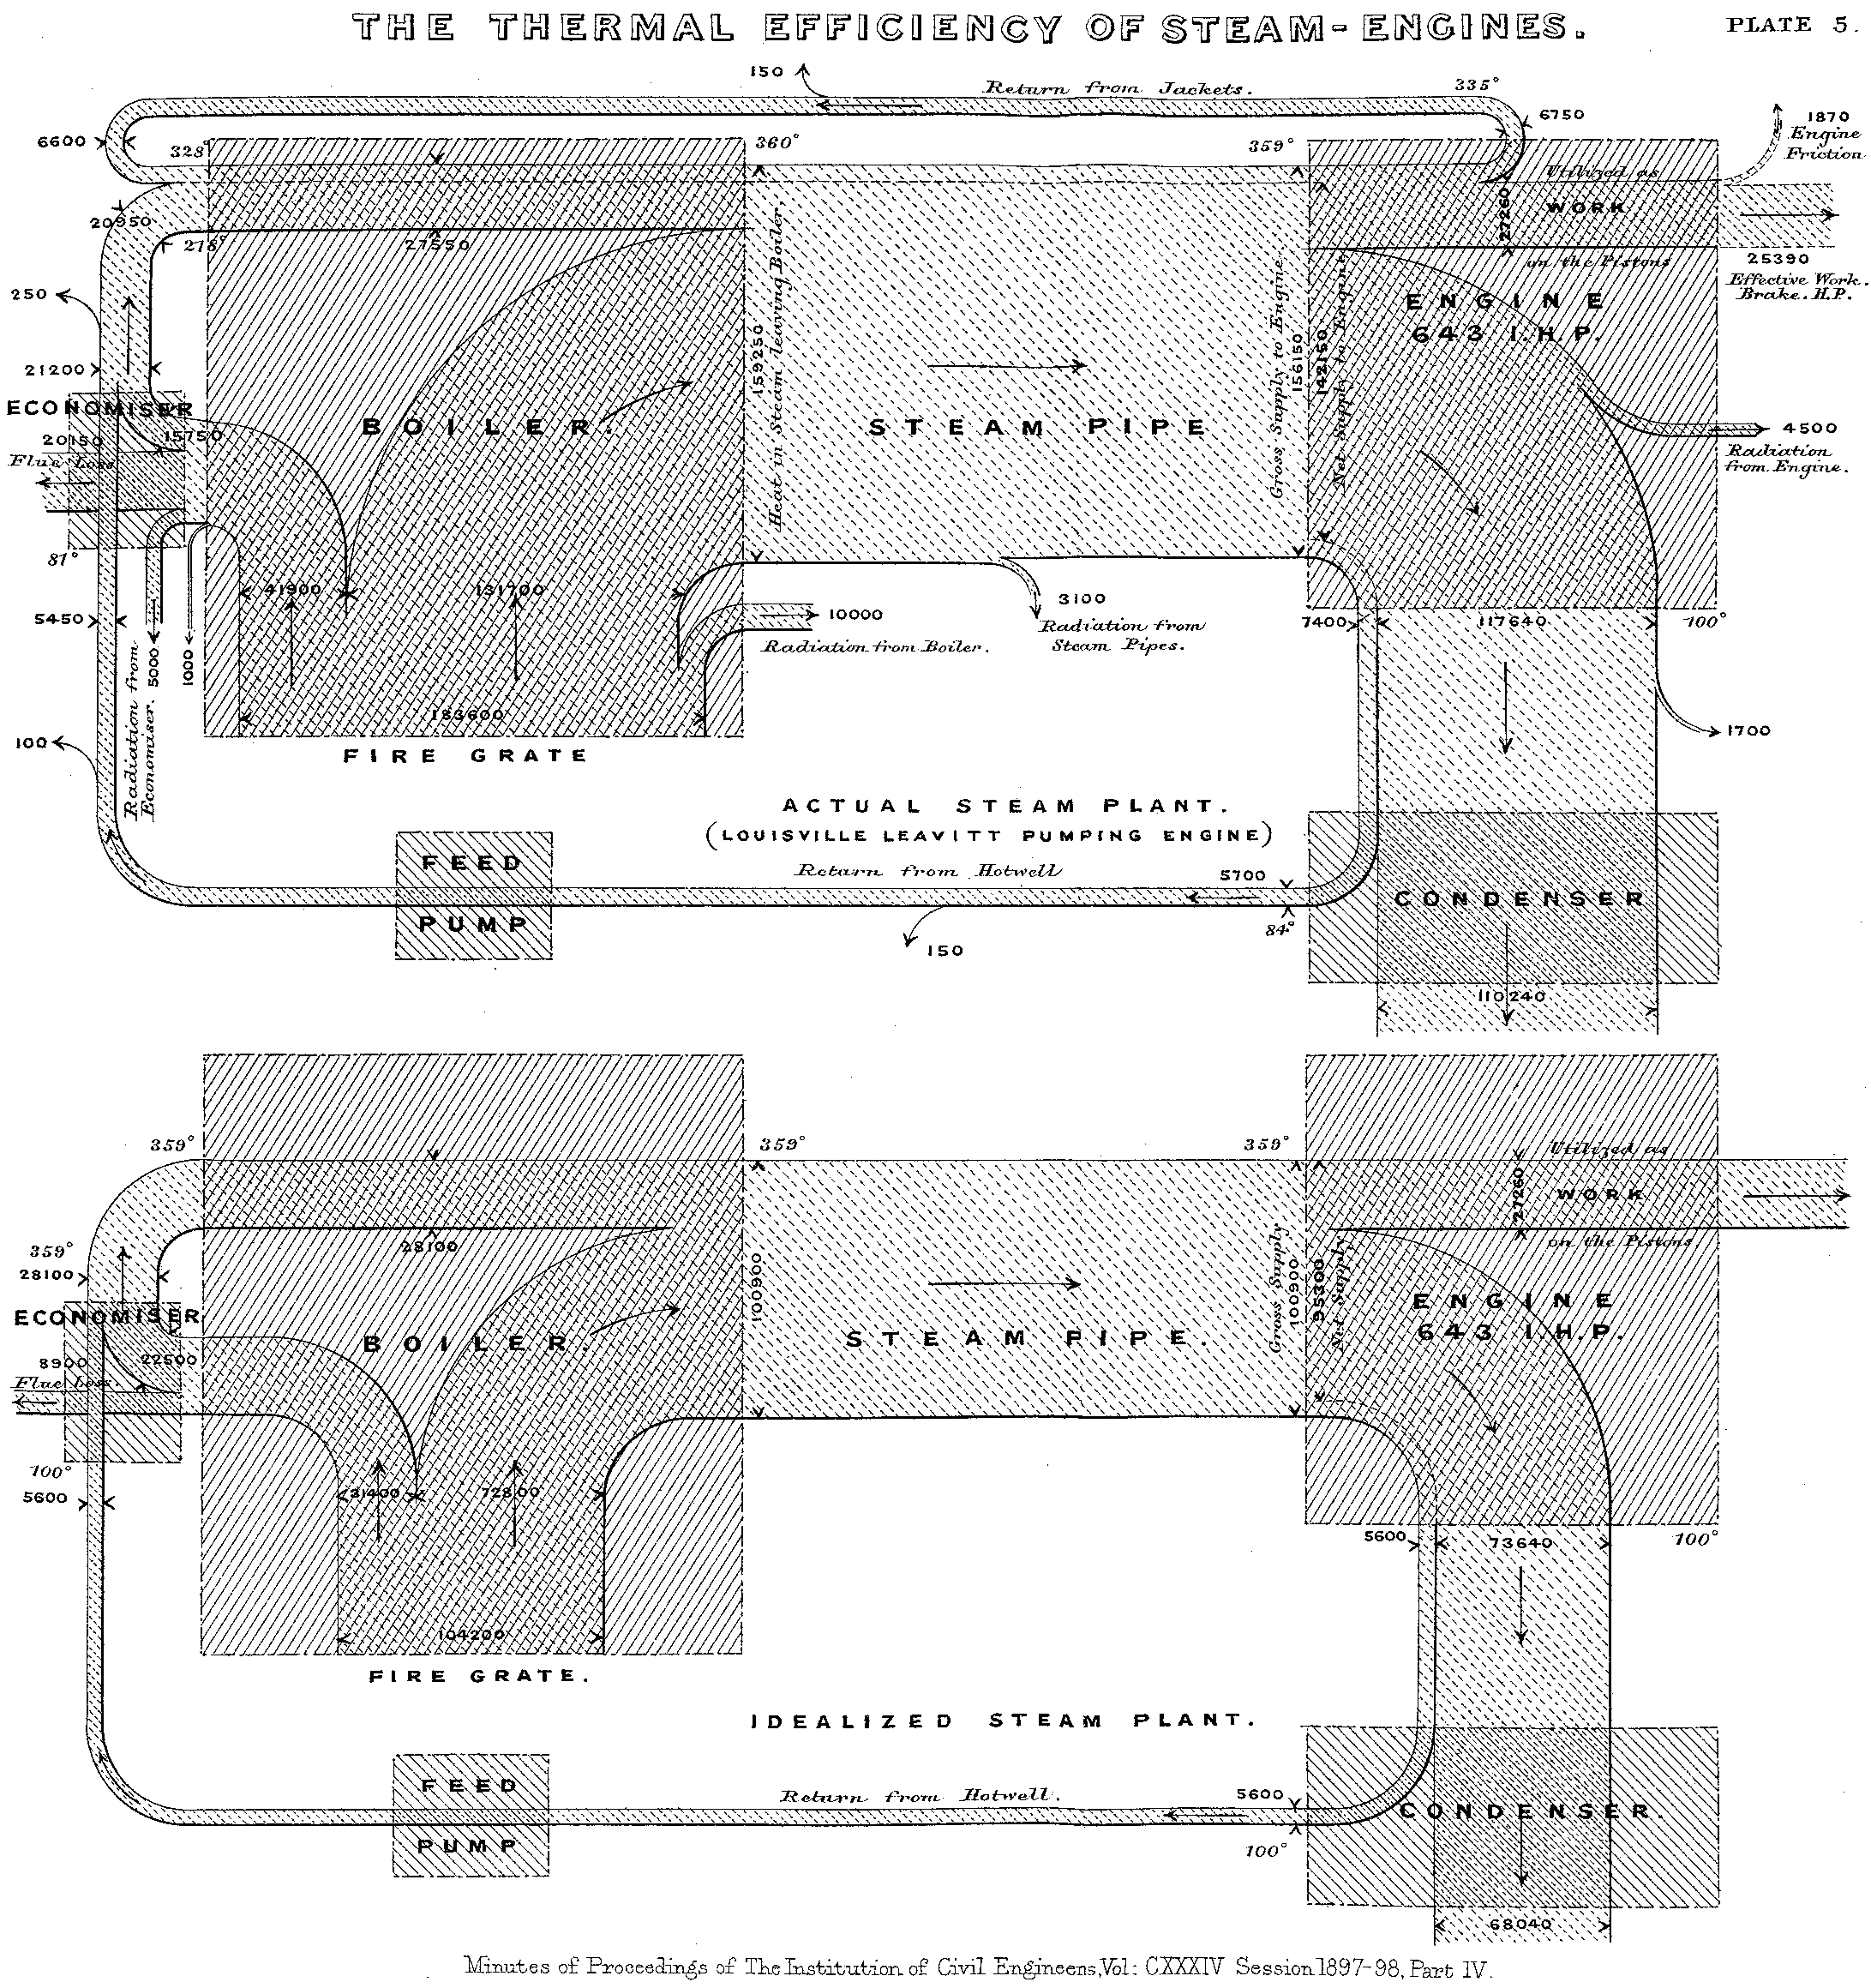
A scan of one of the first – if not THE first ever – published Sankey diagrams has now been added to the Dutch and German Wikipedia articles. Actually I had always wanted to get hold of a digital version of this this energy efficiency diagram published by Captain Henry R. Sankey in 1898 in the Minutes of Proceedings of The Institution of Civil Engineers. Vol. CXXXIV, Session 1897-98. Part IV.

First Sankey diagram published 1898 in JIE (Source: Wiki Commons)

Click here to see the image in original size.

Sankey used this novel type of diagram to represent energy flows and energy losses in a steam engine, comparing it to an ideal steam engine.

Decentralized Energy Benefits

The World Alliance for Decentralized Energy (WADE) runs a website on decentralized energy, called localpower.org. It has a strong educational element, and shows the benefits of producing energy locally, rather than in central power plants.

“Centralized power plants waste huge amounts of energy because their heat output cannot be used locally. Efficiency of the US electricity system, for example, is even lower today than in the early 20th century, and far below its potential.”

WADE - Showing the losses of centralized power plants

The Sankey diagram shown on the website (full size image) illustrates the losses of centralized power generation and is explained as follows:

The large red arrow represents energy from all fuels wasted in the form of waste heat. Capturing waste heat then clearly represents the largest source of potential for efficiency improvement. (…)
The smaller red arrows represent power consumed by the power plants themselves and the power lost during transmission and distribution respectively. The yellow arrows represent the actual useful energy derived from the original fuel inputs – about a third of the actual energy society should be aiming to use.

I won’t be going into the pros and cons of decentralized energy or centralized power, but rather highlight the good and the weak points of how Sankey diagrams are presented: This Sankey diagram doesn’t show any units, a fact that makes it susceptible to criticism. The insterstices in the green area on the left, meant to be separation lines, are somewhat strange (they make me think of an ancient Mayan comb), and do of course conflict with the idea of maintaining arrow width to scale. Lastly, the large arrow heads on the right side overdo the real width, underpinning the statement that a large portion of energy is being lost.

Cardboard and scissors to make Sankey diagrams

The website of Nottingham City Schools offers a variety of materials that can be used by teachers in their courses. One of the key areas in the science field is ‘energy’.

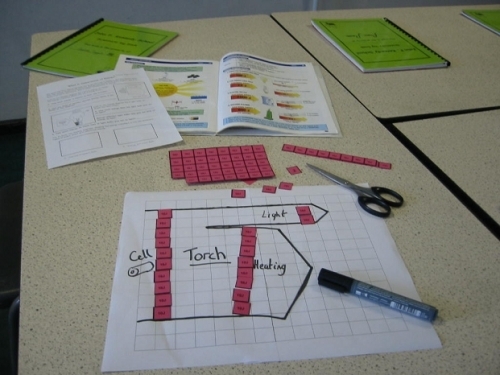
The site has a demonstration of how Sankey diagrams may be used to represent transfer of energy, including a PowerPoint and “stories”, for which pupils can create a Sankey diagram by using tokens cut from cardboard.

I think this is a great idea, as it supports the understanding of the energy topic with a haptic and, very importantly, a visual approach.

Biomass dominates energy flows in Sri Lanka

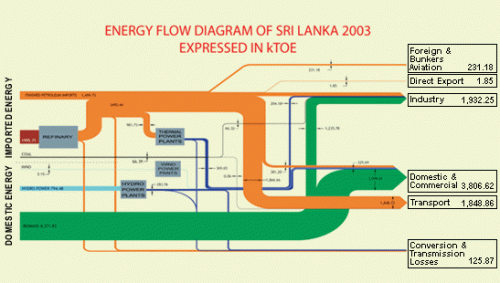
Do you know what country uses the top level domain “.lk”? Well, I didn’t know it either, until I came across this fine Sankey diagram of the energy flows of Sri Lanka on the website of the country’s Energy Conservation Fund. This island country (formerly known as Ceylon) has some 20 million inhabitants.

The flows in this Sankey diagram are in ‘kTOE’ (TOE = tons of oil equivalent). It shows that most of Sri Lanka’s energy in 2003 came from domestic biomass, the second largest domestic source is hydro power. Imported sources of energy are crude oil (refined in the -currently- sole Sri Lankan oil refinery), petroleum and a small portion of coal.

On the consumption side the largest energy using sector is domestic/commercial, followed by industry (using biomass generated energy as well) and transportation.

Transmission losses are relatively small compared to the situation in other countries. The energy flow picture of Sri Lanka thus is quite different to those I have previously presented here on this blog, such as for the U.S. or for Scotland.

What it takes to power a bulb

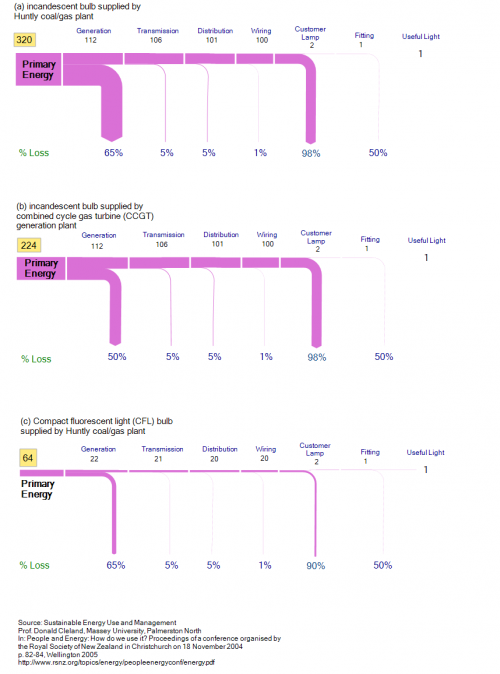
An article titled “Sustainable energy use and management” by Prof. Donald Cleland from Massey University in Palmerston North, New Zealand (published in: People and Energy: How do we use it? Proceedings of a conference organised by the Royal Society of New Zealand in Christchurch on 18 November 2004, p. 82-84, Wellington 2005) features three neat Sankey diagrams as an example for (un)sustainable energy use.

It is a comparison of how much energy is being used to power a lamp. The Sankey diagrams does not work with absolute values, but rather are scaled to one unit of “useful light”. You should read them “upstream” (from right to left) for better understanding. The first two diagrams (a and b) are regular incandescent bulbs. The third one (c) is a compact fluorescent light (CFL) bulb.

The bulb in the first scenario (a) is powered with energy from a coal/gas plant, which has an efficiency of only 35%. Further losses occur during transmission and distribution and at the bulb itself (98%).

In the second diagram (b) a combined cycle gas turbine (CCGT) power station provides the energy. It has a 50% efficiency.

The third one (c) uses energy from a common coal/gas plant again, but the customer uses a CFL bulb.

“A CFL is about 5 times more efficient so the losses reduce from 98% to 90%. In other words, a 20 W CFL produces about the same light as a 100 W incandescent bulb. Translated through the supply chain this means that the primary energy use is reduced to 64 units per unit of light, even if [a coal/gas plant] is still used. This is an 80% reduction in energy use. The benefit of a demand-side technology addressing the most inefficient part of the supply-chain is clear.”

Thus, the same amount of useful light can be produced at 64 units of energy in contrast to 320 units of energy.

Note: In the original publication the Sankey diagrams are not to scale to each other, so that the arrows for the primary energy values (320 units in the first, 224 units in the second, and 64 units in the third one) on the left all show the same magnitude. By bringing all three flow diagrams to the same scale, the significant difference between them becomes even more visible.

Heat Losses of a Family Home

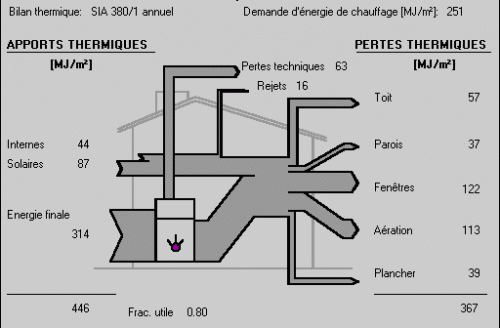
A few months ago I had found this b/w Sankey diagram on the website of the Institut de Génie Thermique (IGT) de la Haute Ecole d’Ingénierie et de Gestion du Canton de Vaud (HEIG-VD) in Switzerland, showing the energy or heat balance (bilan thermique) of an average family home.

It visualizes the sources of heat as Sankey flows into the building (in MJ per square metre) with the largest chunk being the combustible for the heating system, other inputs are from solar radiation and internal sources. On the right side it shows how and where heat is being lost: windows (fenétres) 122 MJ/m², ventilation (aéreation) 113 MJ/m² or roof (toit) 57 MJ/m². Also, the technical losses from the heating equipment (pertes techniques, shown as Sankey arrow from the heater to the top) are quite significant (57 MJ/m²).

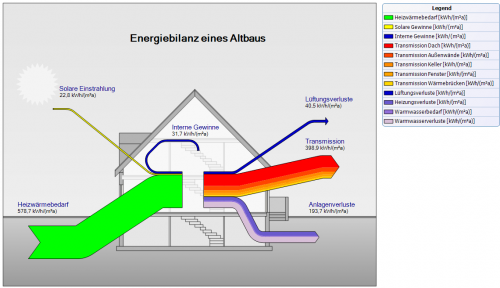
A similar Sankey diagram in German was presented on the e!Sankey forum recently.

This diagram submitted by one of their users is explained as follows:

In the diagram the group of flows in red colors are heat losses due to transmissions through walls, windows, doors, etc. The dark blue arrow shows heat loss through ventilation. The stacked purple/mauve flow represents heat losses at equipment and pipes.

While a little more detailed in the number of flows, it shows the same general situation: In many houses “a lot of the heat gets lost due to heat leaks (thermal bridges) or insufficient external insulation.”