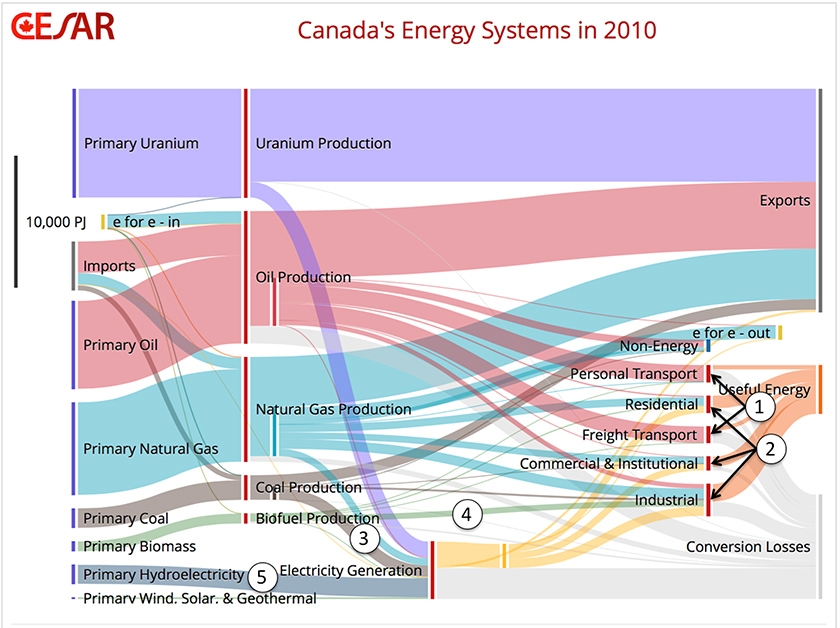
Featured on the Canadian Energy Systems Analysis Research (CESAR) blog is the below Sankey diagram on Canada’s Energy Flows in 2010. The article reports about a new model called ‘CanESS’ (Canadian Energy Systems Simulator) developed by Technologies Inc. and the University of Calgary.
Pulling together data from different sources the tool can visualize energy flows as Sankey diagrams.
The big picture of Canadian energy in 2010 is as follows:
“Canadian primary energy production in 2010 was nearly 25,600 PJ, and after including 3,700 PJ of imports, total primary energy availability was 29,500 PJ. As the Sankey diagram shows, 58% was exported, with the remaining 42% or 12,500 PJ being used domestically, 910 PJ for non-energy applications and 11,652 PJ for the provision of energy end use services to Canadians.”
Read the full article by Ralph Torrie on “the big picture” here.
There is an interactive version that allows you to choose the year (1978-2010), to break down the data onto each Canadian province, or change the unit. Try it out!
