Category: Methodology

Infographics Experts on Sankey Diagrams (Part 2)

Following yesterday’s post with the translation of a blog post by Chiqui Esteban from infografistas.com here is the translation of the post “Caudales, erogación… ¿flujo?” of April 5, 2009. Again, I left some words in Spanish in square brackets.

— translation start —

Volume flow, distribution… flux?

A new chapter in the discussion [polémica] about the ‘scientific’ name of the “little arms” graphics [‘gráficos de bracitos’].

Xocas came up with the name ‘volume flow’ diagrams [‘gráficos de caudales’] and my vote was for ‘distribution diagram’. Other suggestions were thrown in: Xoán G. made reference to Minard and his ‘capacity diagram’ [‘gráfico de aforo’]. Herminio J. Fernández voted for cosmography diagrams [‘cosmografías’] as refered to by Stovall [Infographics by James Glenn Stovall, Allyn&Bacon, Massachussetts, 1997]. Many others voted for ‘flow diagrams’ [‘gráficos de flujo’], although Xocas discarded this suggestion because “the term flow diagram normally refers to a very specific type of visualization of process [flows]. It could be used as a generic term, but has interference with another model”.

Now, there is a new player in our conversation. It is Mario Tascón, who also believes that the correct denomination is ‘flow diagrams’. His justification:
“According to Harris (Information Graphics) and Bruce Robertson (How to make Charts and Diagrams) these graphics are called flow diagrams, and are of the type in the same category which are used as decision diagrams in informatics [computer science]. The latter are more in fashion now [Por motivos de modas], but the former have always [sic!] existed (a historic example is the one of Napoleons troops)”.

Suggestions are welcome in the comments.

— translation end —

I hope I got it more or less correct. It is not easy to find the right translation for the sometimes subtle differences between the terms. For those of you who can read Spanish, please check out the original post and the full discussion thread on Xocas’ blog.

The post is decorated with this beautiful Sankey diagram.

It shows the main earnings and spendings of Spain in 2008 and was produced by Jorge Doneiger and Álvaro Valiño for the daily newspaper Publico in 2007. Values are in million Euros. Flows are not always to scale as for as I can see: the ‘impuestos especiales’ in dark black and the ‘deuda pública’ (at the bottom on the right side) are examples.

The top part shows the sources of funding, the bottom part the beneficiary sectors. The fact that the stacked width in the middle is wider than that of the funds distributed suggests that the Spanish state is actually piling up its money, but probably this has to do either with the list of recipients not being complete, or with earnings received in 2008 but not distributed in the same year.

The hand with the coin supports Chiqui Esteban’s vote for naming it a ‘distribution diagram’. Toss a coin in the coffee dispenser and wait for your coffee to be poured… errh, did we have ‘dispenser diagram’ already? 😉

I save the ‘best of comments’ and my reasoning why I still call them Sankey diagrams for another time…

Note (Aug 19): A case of DYRF, do your research first! I just detected that Chiqui himself has an English version of his article here. So, now you got the choice between two versions!

Infographics Experts on Sankey Diagrams (Part 1)

Chiqui Esteban who runs the Spanish blog infografistas.com had two posts back in March/April about a discussion he had with his colleague Xocas on how to name Sankey diagrams. Or, to be more precise: how a certain type of diagram that is more and more used in infographics should be named correctly.

They are absolutely funny, so I am trying to give you a translation of these two blog posts. This is part 1 for a post from March 17 titled “Gráficos de erogación”. I left some words in Spanish and my comments in square brackets.

— translation start —

Distribution Graphics

A couple of months ago, Xocas and I discussed via GTalk what the name, or what should be the name of the diagrams with the little arms [‘gráficos de bracitos’]. As it turned out, the winner name was volume flow graphics [‘gráfico de caudales’].

Today, we decided to withdraw our proposal and we are going to call them ‘distribution graphics’ instead [‘gráficos de erogación’].

This is because of the coffee. The coffee machine of my new employer www.lainformacion.com (click the link, we are already up running), shows the message ‘distributing’ [‘erogando’] while you wait for your cup to be filled. Looking in the RAE [note: Real Academia Española], the verb ‘erogar’ is defined as:

(Del lat. erogāre).

1. tr. Distribuir, repartir bienes o caudales. [distribute, share the goods or funds]
2. tr. Méx. y Ven. Gastar el dinero. [México and Venezuela: spend money]

This definition is spot on. So we shouldn’t continue to call them ‘little arms’ [‘de bracitos’], ‘tubing’ [‘de tubería’], ‘squid’ [‘de pulpo’], ‘tree-roots’ [‘raíces’] or whatever diagrams any more. But don’t say that we didn’t work hard in finding the correct nomenclature. As we have to do. So Tufte will… [‘A Tuftear’].

— translation end —

The accompanying Sankey diagram apparently is from the New York Times and shows how 21.4 billion $ in federal aid for NYC after 9/11 were distributed (hey! there you are, a ‘distribution diagram’ 😉 ). Funny enough, the caption says: “The figure above is an attempt to bring sources of funds together and show how they add up (sic!) to $ 21.3 billion”.

So what is distribution for one, is “adding up” from another perspective.

Part 2, the translation of “Caudales, erogación… ¿flujo?” and a summary of the comments to follow.

Note (Aug 19): A case of DYRF, do your research first! I just detected that Chiqui himself has an English version of his article here. So, now you got the choice between two versions!
Sankey Diagram in Visual Reports

I was very delighted to see a blog post on visual reports on Arup’s fieldofactivity.com blog with an embedded video that has Sankey diagrams.

Arup Australasia’s Digital Innovation Team is working on interactive reporting technologies. They say that “… not everyone reads technical reports, so this is the beginning of what’s next – visual reports.”

Check out the video, it is interesting, and watch out for the Sankey diagram seconds 0:15 to 0:21

What we see is a Sankey diagram unfolding in an animated sequence. One step further would be animated Sankey diagrams, like the research project I posted about that came up with a Java/Quicktime animation on energy flows, and this Sankey animatedGIF on CO2 and energy from 1990 to 2015.

Any other animated Sankey diagrams out there…?…

VisioGuy invents Radial Sankey Diagrams

Chris the VisioGuy recently came up with Radial Sankey Diagrams. Although he didn’t seem to be sure if there is a “need for radially-oriented Sankey diagrams”, the commentators of his post immediately came up with ideas: use for rotating or radiating processes, cigarette rolling, recursive industrial processes, reinvestments, and so on… even stellar nuclear reactions were mentioned.

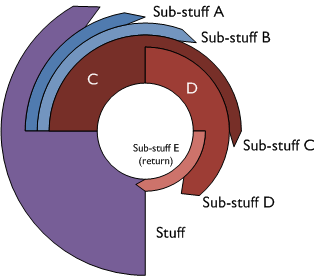
This is the ‘Everything Radial’ Circular Sankey Diagram

… and this is the ‘Tangential Fly-off’ Circular Sankey Diagram

One concern seems to be that the proportional arrow magnitude doesn’t work that well, since the human eye perceives the arrow area rather than thickness in such a circular Sankey diagram.

Thanks VisisoGuy for this contribution to the big basket of Sankey diagrams

U.S. Oil Import Sankey Movie

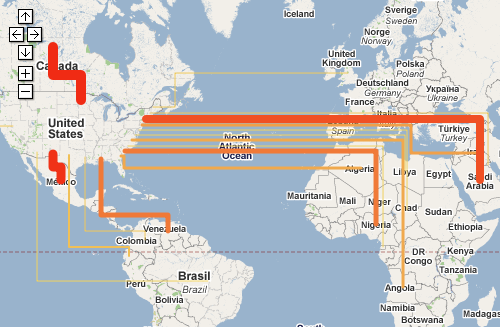
Renown Rocky Mountain Institute (RMI) founded in 1982 by Lovins and Lovins have an interactive oil imports map on their MOVE project webpage.

You can see the oil imports to the United States from January 1973 to August 2008 on a map that depicts the flow quantities as Sankey arrows linking the country of origin and the U.S. If you switch to the unit “Dollar”, you can see the value of the oil imported depicted as Sankey arrows.

One can play the the whole 35-year period as a movie, or use the slider on the time line to see individual months. The data used is from publicy accessible EIA/DOE statistics.

The United States is still 60 % dependent on imported oil. MRI’s MOVE project seeks possibilities to reduce foreign crude oil dependencies. The goal is to “get completely off oil by 2050, led by business for profit.”

Go to the RMI movie page and try it yourself. When I did the Lybia Oil Export map last year I wasn’t aware of this Sankey movie, which is of course much nicer.

Sankey Diagrams are Directed Weighted Graphs

For those of you interested in some of the maths behind drawing Sankey diagrams properly, you might want to read this article on ‘Programmatic Rendering of Directed, Weighted Graphs’ submitted for SVG Open 2003 by Philip A. Mansfield and Mark Ambachtsheer of SchemaSoft.

The authors consider Sankey diagrams as directed weighted graphs but they “can be difficult, time-consuming, and uninteresting to render by hand”. However, “Sankey diagrams do add an indisputable expressive power to a standard mathematical rendering of a graph…[and] when professionally constructed, Sankey diagrams represent flow in a manner … can be understood by anyone, instantly.”

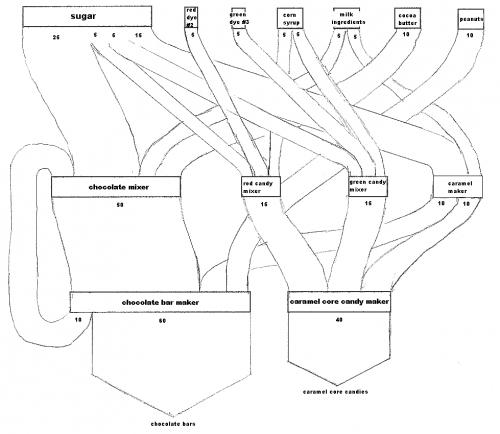
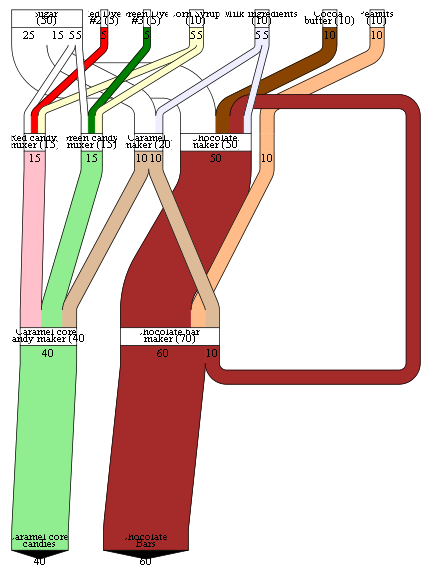
Three diagrams are presented: the first is a simple directed, weighted graph representing a candy factory:

Next, a pen-sketched b/w Sankey diagram of the candy factory…

… and finally the corresponding Sankey diagram in SVG format, created using data in XML format and XSLT style sheet transformation.

They also have some interesting details on graphical problems, such as overlay, edge layout, width of Sankey arrows in curves, etc. Basically all that stuff that developers of professional Sankey software tools have to cope with.

Software Development Bugs Breakdown

This is an interesting one: Saveen Reddy shows a Sankey diagram-like breakdown of bugs in a software development project. The term ‘bug’ is used “…very generically to describe any issue being tracked, not only defects in source code.”.

This does not fully classify as a Sankey diagram, I think, because the arrows don’t seem to reflect any quantities (number of bugs, time spent on bugs, …). But just like the diagram that showed the number of people having been accused and the turnout of the cases I showed here in June 2007, it visualizes a sequence of breakdowns, leading to decisions that are taken (dashed line arrows).

Now, anybody wants to check their bug tracking tool and show a similar diagram but with real numbers?

Utility / Nonutility Sankey for Electricity

DOEs Energy Information Administration (EIA) produces a lot of energy statistics, and they often use Sankey diagrams to illustrate energy flows.

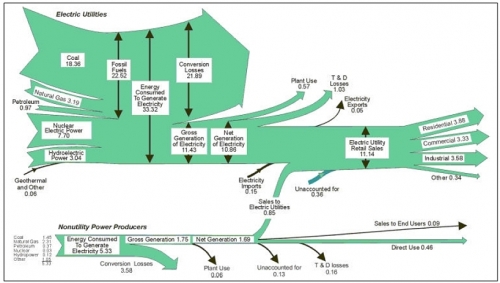
One of their Sankey diagrams that dates back to 1999 has an interesting two-part structure. It actually is made up from two Sankey diagrams, which are connected by one flow. Values are in quadrillion BTUs.

The top part of the diagram shows electricity produced from various sources, losses along the production line, and the consumption of the electricity in the “Residential”, “Commercial” and “Industrial” sectors. This is structured very similarly to other Sankey diagrams EIA publishes annually (example).

The bottom part shows another Sankey diagram for electricity produced by ‘Nonutility Power Producers’. So what exactly are these NPPs?

A corporation, person, agency, authority, or other legal entity or instrumentality that owns electric generating capacity and is not an electric utility. Nonutility power producers include qualifying cogenerators, qualifying small power producers, and other nonutility generators (including independent power producers) without a designated franchised service area, and which do not file forms listed in the Code of Federal Regulations, Title 18, Part 141. (Source)

Half of the electricity produced by Nonutility Power Producers in 1999 was fed into the grid, while the other half was consumed on-site. I imagine these are typically larger industrial facilities, that have their own power generation. The fact that nuclear energy appears in this section does irritates me a little bit, but as this page explains, the reason is probably a nuclear reactor in a national research laboratory, that is accounted for here.