Category: Methodology

A nice one from Poland

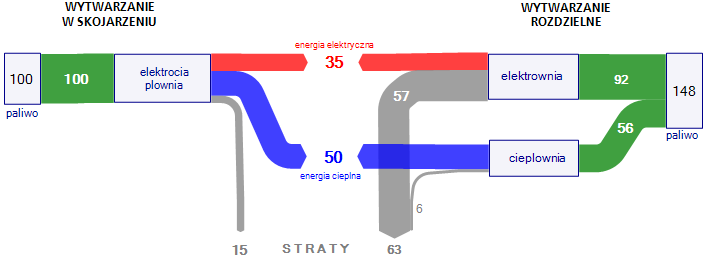
On my quest for more interesting Sankey diagrams I stumbled across a wykres Sankeya on a web page from Poland, which I reproduced here using ifu’s e!Sankey tool.

It shows the advantage of energy cogeneration plants over energy production in separate plants. From a base value of 100 a yield of 85% can be reached in cogeneration plants (35% electric energy, 50% heat energy – the original text accompanying the diagram says 30% electric energy, 55% heat energy) with 15% losses. To get the same energy amount from separate energy generation plants, the required energy feedstock is 1.48 times higher, with losses more than four times higher (63:15), especially originating from the generation of electricity.

While I am far from fostering one or the other technology with this post, I think this Sankey diagram merits special attention, because it is actually a 2-in-1 diagram (both with flow direction left-to-middle and right-to middle) and a baseline scenario comparison. A very nice idea!
Java applet to explore Sankey energy diagram interactively

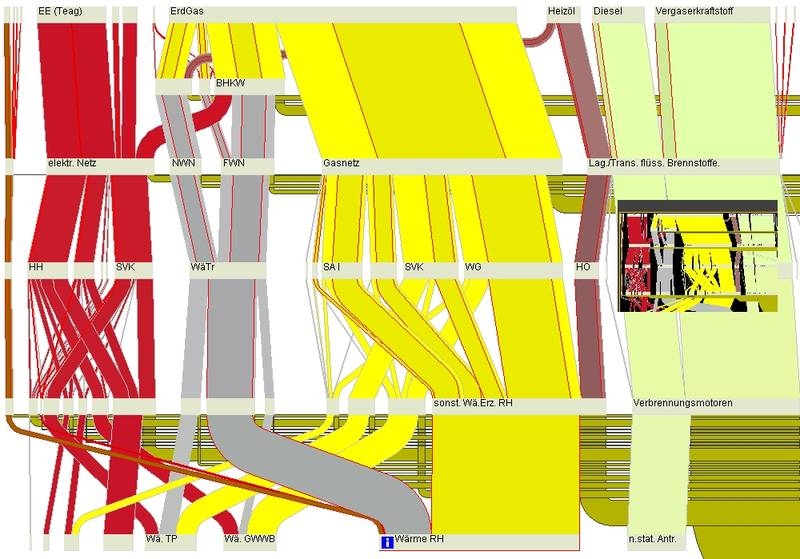
Researchers of the “energy flow” project at Weimar’s Bauhaus University have developed a Java applet to explore a Sankey energy diagram interactively.


The accompanying explanation says:

We present a system that allows users to interactively explore complex flow scenarios represented as Sankey diagrams. Our system provides an overview of the flow graph and allows users to zoom in and explore details on demand. The support for quantitative flow tracing across the flow graph as well as representations at different levels of detail facilitate the understanding of complex flow situations.

The energy flow in a city serves as a sample scenario for our system. Different forms of energy are distributed within the city and they are transformed into heat, electricity, or other forms of energy. These processes are visualized and interactively explored. In addition our system can be used as a planning tool for the exploration of future scenarios by interactively manipulating different parameters in the energy flow network.

The Java-based online version (in German) allows the visitor to interactively explore the Sankey diagram. They can zoom in, move the nodes, or call additional data for individual layers.