Category: Samples

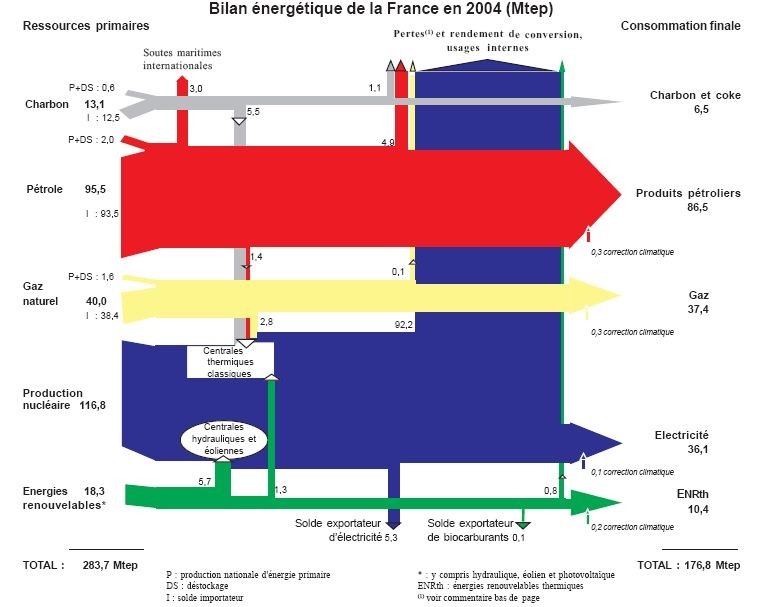
Efficiency Diagram for Ship Engines

MAN Diesel, a renown producer of marine and power plant diesel engines, has been working on improving fuel efficiency of its engines. Today, the fuel energy efficiency is about 50%. The MAN Turbo Efficiency System (TES) allows to recover of heat from the exhaust gas, which is responsible for about 50% of the energy losses.

Here is a Sankey diagram that shows the recovery of energy from exhaust gas.


Download a description of the TES here (PDF, 291 KB)
or view a high resolution version of the above Sankey diagram from their press picture gallery.

Combined Heat Power (CHP) Sankey

Have been very busy recently and have neglected the blog. Here’s just a quick one (to get some color on the top post again … 😉 )

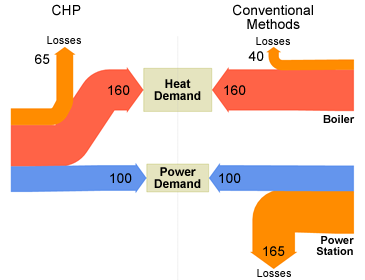
UK’s Department for Environment, Food and Rural Affairs (DEFRA) has crowned its new website on combined heat and power generation with a nice Sankey diagram.

What is CHP? “CHP systems are highly efficient, making use of the heat which would otherwise be wasted when generating electrical or mechanical power (…) and typically has an efficiency of over 80%”, the accompanying text explains.

The diagram is built similarly to this one presented in a previous post: The Sankey diagram doesn’t feature absolute figures, but flows are scaled in relation to the baseline of 100 units energy generation in a power plant and a CHP unit. In a cogeneration unit 160 units of energy would be produced at the same time. Losses are accounted for with 65 units in the CHP. To produce the equivalent energy quanities in a conventional power unit would cause losses 1.65 times higher than the energy output itself. In the boiler 25 % of the energy is lost (40 units).
Overall losses in convential generastion are 205 units compared to 65 units in a CHP.

Sam Brenner’s Sankey Diagram Generator

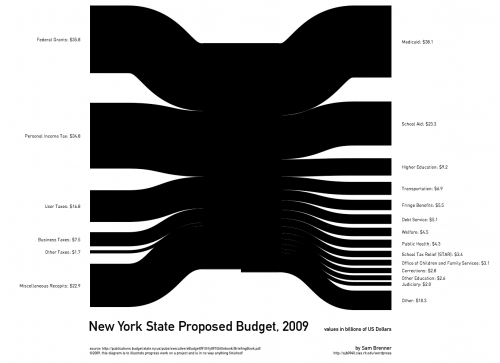
Sam Brenner, interactive design and development student at the Rochester Institute of Technology, has finished version 0.2 of his ‘Sankey Generator’ tool.

Inspired by state federal budgets Sam pursues to display financial figures in a clear and comprehensible way. Sources of state income are on the left, spendings on the right. As Sam says himself, this is still work in progress. “I’m trying to make a dynamic Sankey Diagram generator (…) What I would like to end up with is a program that can take numeric data like a budget and turn it into a diagram…”.

See that small step at the bottom of the middle part? Hey, here you have the “deficit”…

Interesting new tool. Not sure if the Sankey Generator tool will reach a status that would allow Sam to release it publicly, but have added it to my Sankey software list anyway. Hope version 0.3 has some fancier colors, though 😉

Waste Composition Sankey Diagram

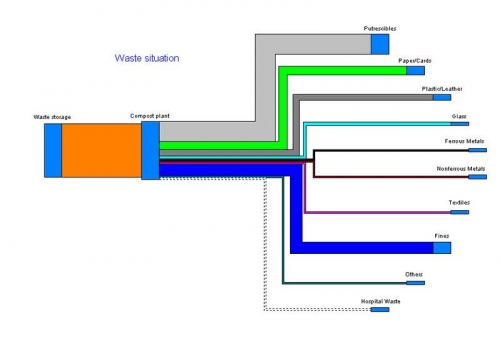
After the rather complex Sankey diagrams presented in my previous post, here’s another comparatively simple one. It is presented on the website of consulting and planning company UMTAS in Germany, to support their services offers in the field of material and energy flow management.

The diagram is just symbolic and doesn’t indicate any absolute quantities or a time period. It merely shows the compsition of waste.


The process labeled “compost plant” seems to be a kind of sorting station, where non-compostable items such as metals are being removed. Hospital waste appears to be absent and the arrow line is shown dotted. The input and output flows of the compost plant don’t seem to match – or is this just a trompe d’oeil?

In fact, the information conveyed in this Sankey diagram is no different from a typical pie chart. [This reminds me of a categorization of Sankey diagrams I had on my to do list]. Still, I think it is a valid representation of the data, and the diagram will get even more interesting, if one starts to study where the waste flow outputs are going to and how they are treated.

Swiss Biomass Sankey Diagrams

Gabor Doka pointed me to a publication by the Swiss EPA (Federal Office for the Environment, FOEN). The publication titled “Biogene Güterflüsse der Schweiz 2006” (‘Flows of biogenic goods in Switzerland in 2006’) features many different Sankey diagrams. “Biogenic goods are defined as goods of biological origin, excluding those of fossil origin”. Data is based on Swiss statistical figures and valid for 2006. Available in German only (Download PDF 7,5 MB).

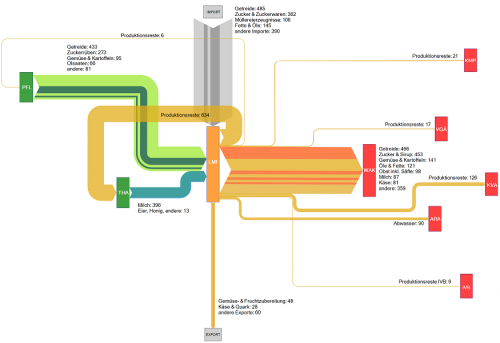
The overall structure of biomass flows is given in a generic layout and as Sankey diagrams with proportional arrow magnitudes for mass flows (unit is in 1000 tons, based on dry matter) as well as for energy content (in GWh, based on lower heat value of dry matter). These overview diagrams are structured in three columns ‘Production’, ‘Conversion’, and ‘Use/Disposal’. Imports are from top, exports to the bottom. This very clear structure for both mass and energy flows makes the complex diagrams easier to comprehend. These overview Sankey diagrams are available for download as a separate PDF file (still 3,2 MB)
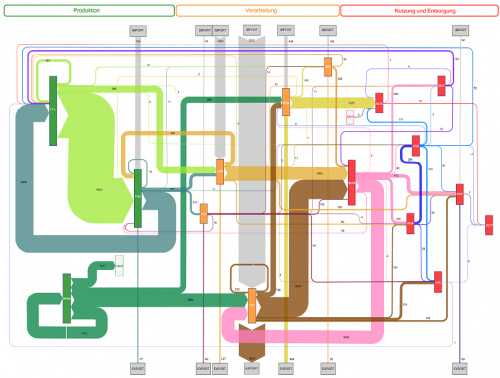
The main diagram is then broken down into individual Sankey diagrams for the different sectors involved, such as plant production (PLB), animal farming (THA), and forestry (WAW) in the production column (orange colored processes), or food industry (LMI) and wood/paper industry (HPI) in the conversion sector (green colored process). Finally, in the use/disposal sector (red colored processes) we find goods consumption (WAK) along with energy generation and waste treatments.

This is the sectoral Sankey diagram for the food industry in Switzerland. We can see that a large part of the biomass for food production is imported, and that most production wastes are fed back into animal farming again. The red boxes are different waste treatments receiving input from the food industry.

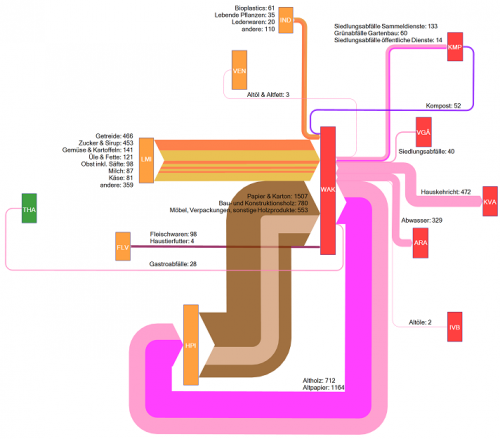
The above is the goods consumption section. Main biogenic goods inputs are from food industry and wood/paper industry. The meat input is rather small comparatively. A big chunk of the mass output (namely waste wood and waste paper) feeds back into the wood/paper industry. 472.000 tons ended up in waste incineration that year, some 329.000 tons in waste water.

The Sankey diagrams in the study are interesting to browse and reveal a lot more interesting facts. The stuctured approach with the breakdown into smaller diagrams is very useful. The authors Baier and Baum from ZHAW at Wädenswil have done a great job in compiling this.

“The results of this study will serve as useful decision aids for strategic planning and assessments concerning the potential, use and management of biogenic resources (…) makes it possible to detect quantitative changes that occurred during a given period of time and to reach conclusions concerning the efficiency of measures taken.

Actually this way of visualizing statistical data with directional (from-to) information attached to it could serve as a role model for other national mass and energy accounts, I think.

Uh – this has become my largest post ever 😮 . But I think this was well worth it and the publication merits it. Your comments appreciated.
Energy Balance of France

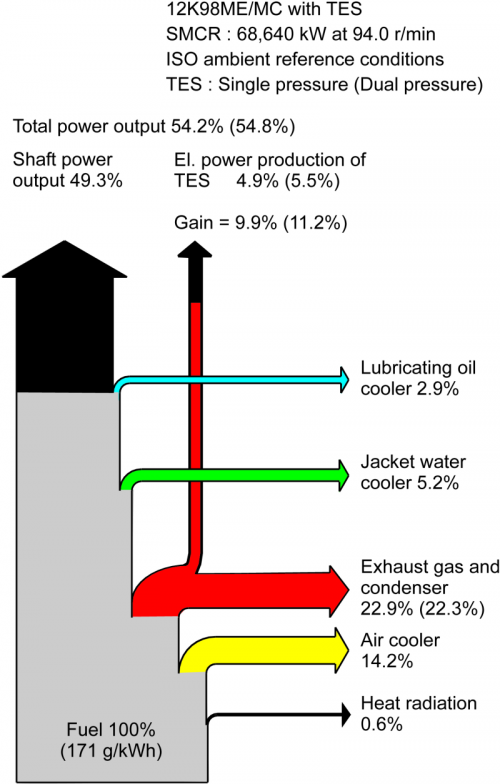
Found Sankey diagrams with the energy balances of France for several years, thanks to this Planète Bleue blog post.

These energy balances are apparently produced annually by French DGEC (Direction Général de Énergie et Climat) and are different from the energy flow Sankey diagrams for various countries I have shown here in other posts.

In these French energy balances the left side shows the primary energy (expressed in mégatonne équivalent pétrole Mtep, mega tonnes of oil equivalent Mtoe in English) broken down into the different sources, the right side shows the final consumption of energy with the same breakdown. The differences are the energy losses and internal consumption in energy generation.

The large losses for nuclear energy are explained in a footnote for the 2007 diagram, where it says that these can be attributed to the fact that ‘Observatoire de l’Énergie’ (OE) accounting standard is based on heat value:

L’importance des pertes dans le domaine de l’électricité tient largement au mode de calcul adopté depuis 2002 par l’OE: l’électricité d’origine nucléaire est comptabilisée, au niveau de la production, en termes de chaleur, dont les deux tiers sont perdus lors de la conversion en énergie
électrique

Nevertheless the Sankey diagram gives a good idea about the efficiency of energy generation for each of the different fuels and the energy mix for France.

For those of you who wish to compare the developments over the last years, here is what I have dug up so far:
2003 is shown on Planete Bleue in this post.
2004 is shown above
2006 can be found here on page 25 (PDF)
2007 can be found here on pages 6/7 (PDF)

Energy Management of Automobiles Sankey

Just returned from a short break … trying to get back into the regular blogging mode again. Here is a quick one from my bookmarks.

The Sankey diagram below illustrates a research project at Hannover University on energy management of automobiles. Similar to the Sankey diagram shown in this post it shows how total energy from gasoline is used in different components of a car.

The Sankey diagram is symbolic I assume, still one can see that large portions of the energy are lost in the exhaust gas (“Abgas”) and for motor cooling (“Kühler”). Flow quantities are given in Watt, not sure if that is per hour at a given speed or in idle mode.

Sankey diagrams on flickr (2)

I remember how a couple of years ago we used to play the board game ‘Settlers of Catan’ for hours and hours… I never got ’round to trying the computer game though.

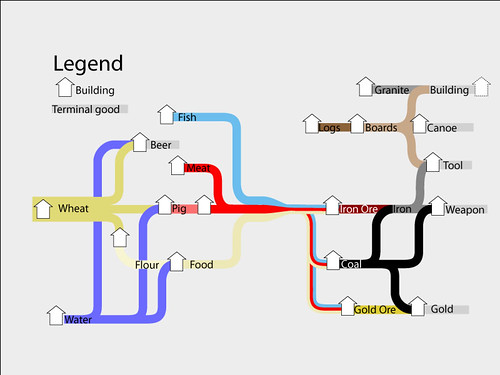
Now I was reminded of these times by a Sankey diagram “showing the resource chains in Settlers 2” that I found on flickr.

Brandel Zachernuk (go to ‘The Desk of Brendel Zachernuk’), who was so kind to give me permission to show his work of art here on the blog, wrote:

I only recently discovered the style of diagram as an approach and was quite surprised they aren’t more frequently used to explain resource flows.
I know that my diagram isn’t strictly a Sankey diagram because the width of the lines doesn’t correspond to anything …

Still, this is a lovely one, and it merits to be presented here! I admire the chain of developments men seems to have to go through: from water and fish and meat (hey, why no beer?) to nourishing people who produce iron ore, coal, tools, and eventually weapons. Some call it technological progress, others unsustainable use of natural ressources.