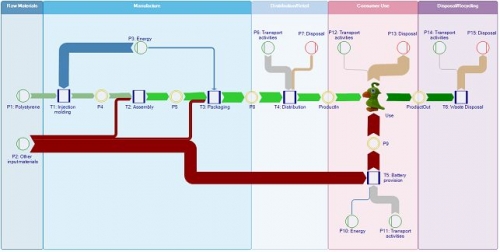
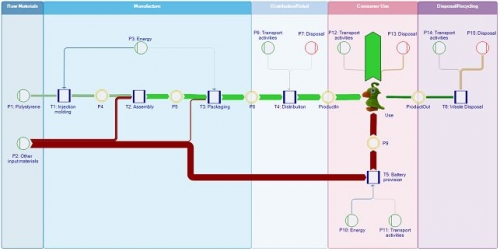
I found the idea behind the below Sankey diagrams quite compelling. Both are from the user manual of the ‘Umberto for Carbon Footprint’ software by ifu Hamburg. They are also the makers of e!Sankey, and it seems as if most of the e!Sankey software features are also included in this new software for modeling and calculating product carbon footprints.
I played with the demo models included in the trial version, one of which is for a toy parrot. The product life cycle is modeled from cradle-to-grave with the raw materials, assembly, distribution, use, and end-of-life phases. Using embodied carbon data from an LCI database for the raw materials and energy used along the life-cycle, a carbon footprint is calculated. The material and energy flows related to the product manufacturing and use are then shown as a Sankey diagram.
The Sankey view can be switched to an ’embodied carbon’ or carbon load view, which shows the ‘carbon rucksack’ of the product as it cumulates along the supply chain.
In this second Sankey diagram the arrows representing the greenhouse gas burdens caused by the waste disposal phase are turned around, so that both the upstream supply chain as well as the downstream processing after the product use are visually added. They form one large Sankey arrow (shown in green here) for the product’s carbon footprint.
This is of course not a Sankey diagram drawing software, but rather a modeling or calcalation tool for carbon footprints. Still, I think, this is a fine use case where Sankey diagrams unfold their full visualization power. It can be immediately grasped which stage of the life cycle, or which raw material or energy supply contributes most to the carbon footprint.
Note: Have added this to the software list.


1 Comment
Comments are closed.