Sankey Diagrams

A Sankey diagram says more than 1000 pie charts

Menu
Samples

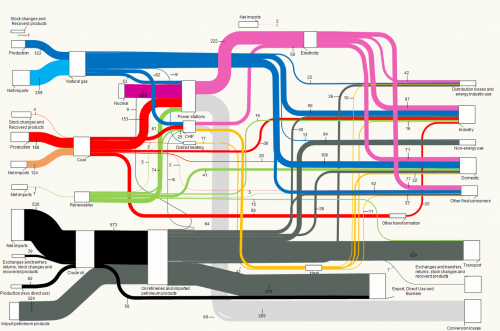
Europe Energy Flows 2012

phineasMay 26, 2015

An updated diagram of the energy flows in Europe has been published on the European Energy Agency (EEA) website. This is for the EU-28 states.

Europe_Energy_EU28_2012

Copyright holder: European Environment Agency (EEA)

I had previously posted about the 2010 diagram (here). The data is for 2012. Flows are in MToe.
TagsenergyEurope
Previous StoryJapan Material Flow 2003
Next StoryFuel Cell Technology Heat Balance

phineas

Pages

  • About
  • Privacy Policy
  • Sankey Definitions
  • Sankey Diagram Software
  • Who is this Sankey guy?

Categories

  • Fakes
  • General
  • History
  • Methodology
  • Publications
  • Samples

Tag Cloud

AustriabiomassbuildingCanadacarChinacircularcogenerationcostefficiencyenergyenergy balanceenergy efficiencyenergy lossEuropeexergyfinancefoodFranceGermanyGHGheathouseLatin AmericamapmetalMFAmoneyNetherlandsprocess technologyremakesoftwareSpainSwitzerlandtradetransportU.S.UKurbanverticalvideowastewaterwoodworld

Blogroll

  • ChartPorn
  • Density Design
  • EagerEyes
  • Flowing Data
  • Infosthetics Blog
  • InfoVis:Wiki
  • Junkcharts
  • MFA Diagrams
  • Visual Complexity
  • Visual Literacy
Sankey Diagrams, Proudly powered by WordPress. Privacy Policy