SEEG Sistema de Estimativas de Emissões de Gases de Efeito Estufa (Greenhouse Gas Emissions and Removals Estimates System) is an initiative of the Observatório do Clima (Climate Observatory) in Brazil.
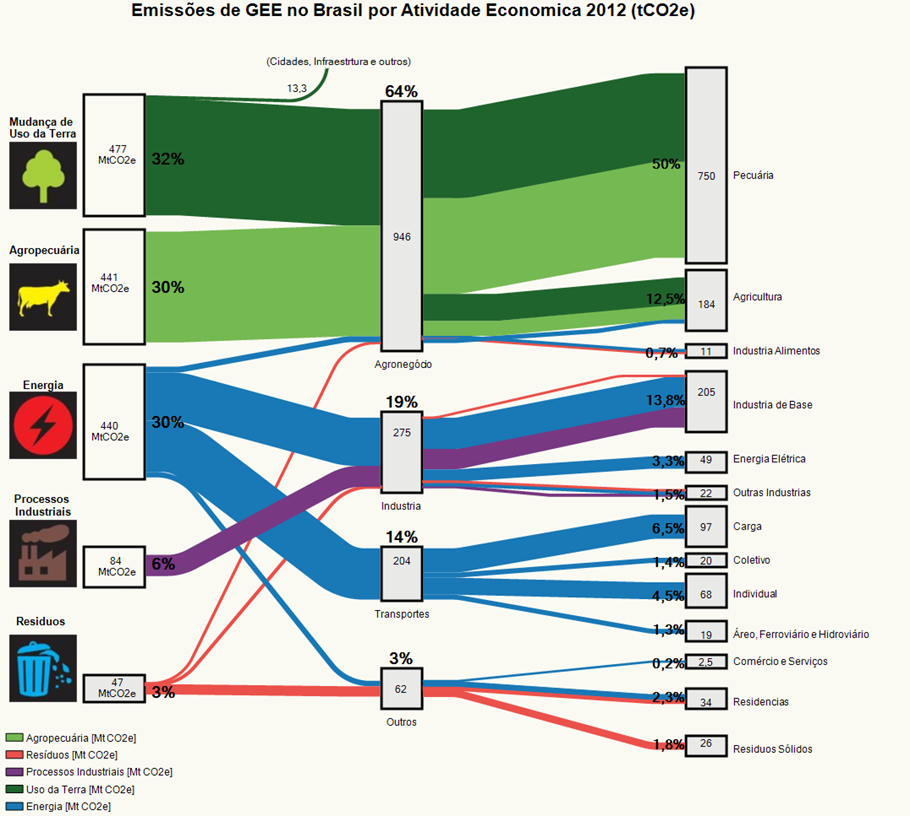
This Sankey diagram on the SEEG web page (in Portuguese) shows greenhouse gas (GHG) emissions in Brazil in 2012.
On the left are the emitters by sector: land transformation, livestock farming, energy generation, industrial processes and waste sector. Emissions are grouped in the middle column by activity: agriculture, industry, transport and other. The third column is a detailed breakdown of the activity sectors.
The agricultural sector contributed 64% of Brazil’s GHG emissions in 2012, with most likely methane (CH4) from livestock breeding and CO2 release from deforestation as the major sources.
Emissions are shown in Mt CO2-e[quivalents], even though the caption says differently. Overall greenhouse gas emissions were 1490 Mt CO2e (or 1.49 bn tonnes CO2e). Detailed data is available on the website, so this can be seen as the consolidated overview of GHG emissions.
More recent GHG data for 2017 from Brazil has been published at an event in November 2018 in São Paulo, but I couldn’t find a Sankey diagram (yet).
