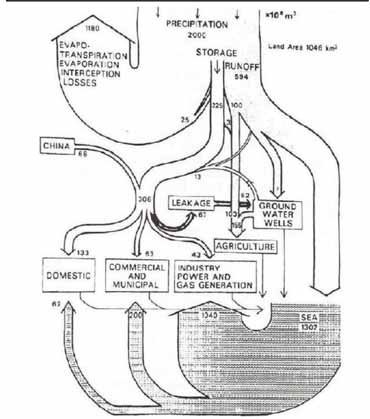
Sometimes I get a little nostalgic… Here is a Sankey diagram of water flows in Hong Kong. My guess is that it pre-dates 1997, so this would be the former British colony Hong Kong. Originally published in Worldbank’s Eco2 Cities book (Hiroaki Suzuki, Arish Dastur, Sebastian Moffatt, Nanae Yabuki and Hinako Maruyama. Eco2 Cities: Ecological Cities as Economic Cities. 2010), it is pictured in this guide(link currently broken) on page 41.
Flows of water are shown in 1.000.000 m³ of water (difficult to see, but I read this as 10 to the power of 6). Obviously hand drawn, so flows are not fully to scale.
Hongkong receives an average 2.000 Mm³ of precipitation (per year?) on a land area of 1.046 km² (interesting: todays area is 1.108 km²). Most of the water directly evaporates, and a large chunk goes into the sea.
This is considered an early example of a material flow analysis (MFA) visualization, and also of an urban metabolism study.
