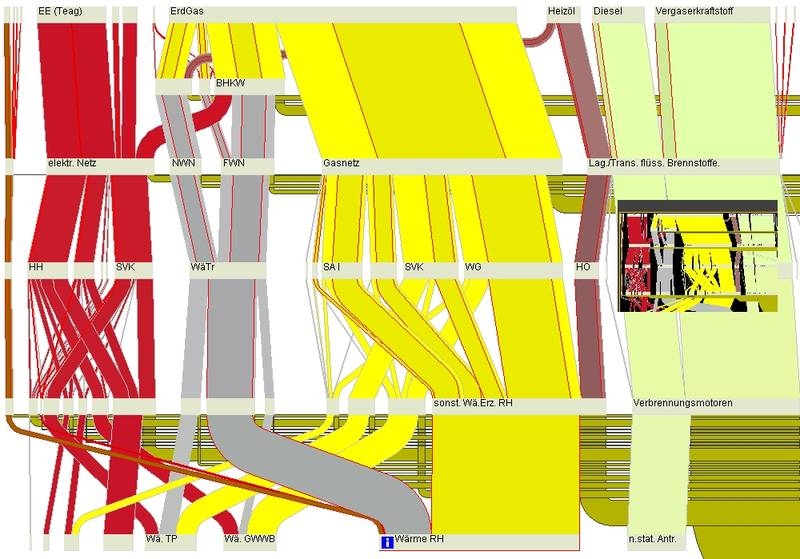
Researchers of the “energy flow” project at Weimar’s Bauhaus University have developed a Java applet to explore a Sankey energy diagram interactively.
The accompanying explanation says:
We present a system that allows users to interactively explore complex flow scenarios represented as Sankey diagrams. Our system provides an overview of the flow graph and allows users to zoom in and explore details on demand. The support for quantitative flow tracing across the flow graph as well as representations at different levels of detail facilitate the understanding of complex flow situations.
The energy flow in a city serves as a sample scenario for our system. Different forms of energy are distributed within the city and they are transformed into heat, electricity, or other forms of energy. These processes are visualized and interactively explored. In addition our system can be used as a planning tool for the exploration of future scenarios by interactively manipulating different parameters in the energy flow network.
The Java-based online version (in German) allows the visitor to interactively explore the Sankey diagram. They can zoom in, move the nodes, or call additional data for individual layers.

3 Comments
Here is a movie they made to explain their system: Link (Quicktime browser plugin required)
Wow, sankey diagrams on Java platforms. It is something special and original. I would definitely try them, because I deadly want to see those interactive diagrams. By the way Java is my favorite programming language so it will be the double pleasure to watch this. Thanks for this useful post! I will be waiting for another great ones from you.
Sincerely,
Brad Taylorson from java software development
Comments are closed.