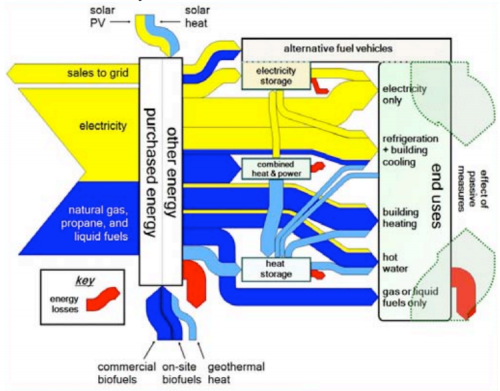
Found the below Sankey diagram in the article ‘Plug-in Electric Vehicle Interactions with a Small Office Building: An Economic Analysis using DER-CAM’ by Ilan Momber et al. from Berkely National Lab published in Proceedings of the 2010 IEEE PES General Meeting, Power Systems Engineering in Challenging Times, 26-29 Jul 2010, Minneapolis MN.
The Sankey diagram is for illustration only, and consequently shows no numbers. Yellow arrows represent electricity, blue arrows heat. The red Sankey arrows show where losses occur. The article itself is mainly on plug-in vehicles (PEV), that’s why the ‘alternative fuel vehicles’ are emphasized on the right side in the uses section.
The underlying model DER-CAM “solves a commercial building’s microgrid problem of investment and operation optimization given its end-use energy loads, energy tariff structures and fuel prices, as well as an arbitrary list of equipment investment options. … [It] can report a cost, carbon footprint, or combination minimizing equipment choice and (typically hourly) optimal operating schedule for the microgrid, including CHP and renewable sources.”

1 Comment
Comments are closed.