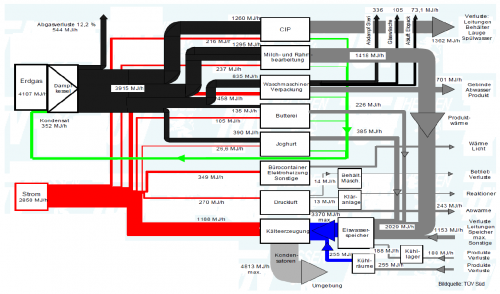
From a presentation on energy management held by Thomas Keller of Ecowin (available at the KNUT Hessen website) comes the following Sankey diagram.
The diagram is in German, but I get the main point: Energy and heat consumption in a company in MJ per hour. Fuels are natural gas (black streams) and electricity (red streams). The white boxes are the processes consuming the energy. Grey flows are transformed energy or losses.
Data seems to come from a energy management software with measuring devices installed along the production line. The company is about to obtain ISO 50001 certification.
I have recently noticed an increased use of Sankey diagrams in ISO 50001 case studies. Hope to see more of them coming.
