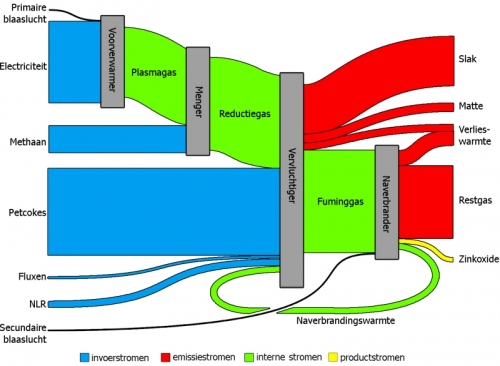
Found the Sankey diagram below in an article on ‘Exergetic efficiency analysis of pyrometallurgical processes’. It is from a master thesis by Bart Klaasen (PDF file), that contains several Sankey diagrams.
The main diagram is titled ‘Exergetic Sankey diagram for a zinc recycling process’. Input streams are in blue, emission streams are in red. Internal flows are colored green, while yellow represents the actual product.
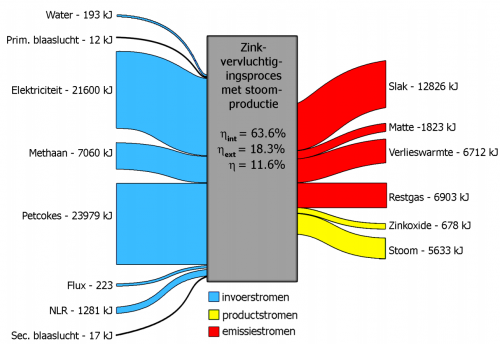
The flows don’t show arrow heads, but a general left-to-right direction can be assumed. No values in the above overall Sankey diagram, but for each process step individual input/output Sankey digrams can be found that feature exergy data in KJ. They look like this one:
In contrast to Sankey diagrams that represent energy flows, the input output flows into a process node don’t have to have the same magnitude. Exergy is synonymously called “available energy”.
“Energy is never destroyed during a process; it changes from one form to another (see First Law of Thermodynamics). In contrast, exergy accounts for the irreversibility of a process due to increase in entropy (see Second Law of Thermodynamics). Exergy is always destroyed when a process involves a temperature change. This destruction is proportional to the entropy increase of the system together with its surroundings.” (Wikipedia)
So it is understandable that the exergy represented by the flow magnitude at the output of the process is less than the one of the flows on the input side.
NB: Bart’s article reminded me of some bookmarks to exergy diagrams I have, will try to post these in the near future too.


1 Comment
I just discovered my flowcharts amongst all the other beautiful Sankey graphics at this wonderful blog. Nice!
If anyone is interested in this particular study: more details can be found here:
http://dx.doi.org/10.1007/s11663-010-9424-y
https://lirias.kuleuven.be/bitstream/123456789/282844/1/doi_10.1007_s11663-010-9424-y.pdf
Comments are closed.