Tag: book

What’s in a Book? Sankey Diagrams!

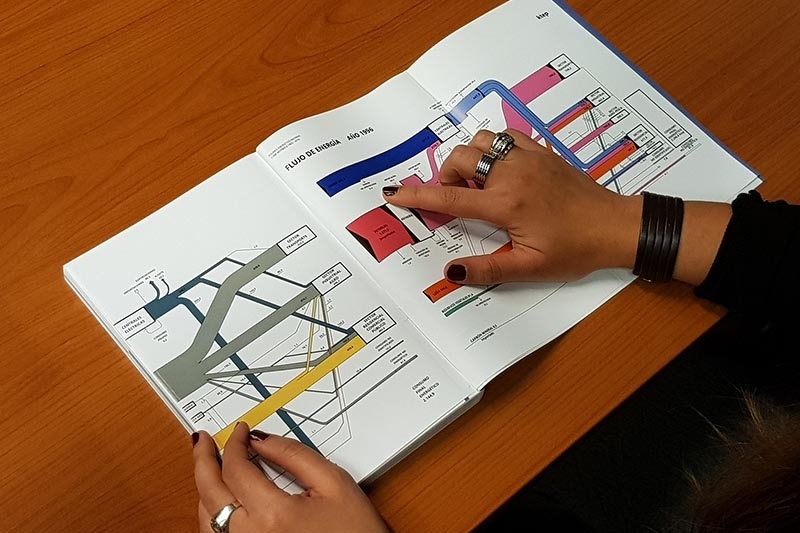
I would love to get a copy of the book shown in the picture below… but then it is probably just a symbolic photo of someone studying the energy balance of a country (the caption reads “Energy Flows Year 1996”).


This find has inspired me to a new mini-series of posts on national energy balances shown as Sankey diagrams with a focus on Latin America.

Here is the list with links to all post so far:
Argentina: 2010
Bolivia: 2014
Brazil: 2014
Chile: 2015
Colombia: 2012
Costa Rica: 2010, 2015
Ecuador: 2017
Guatemala: 2011
Honduras: 2017
Mexico: 2011 and 2016 (coming up)
Panama: 2018
Paraguay: 2017
Peru: 2009, 2017
Uruguay: 2015

Update 04/2020: I am still looking for energy balances for a number of Central American countries (Nicaragua, El Salvador) and for Venezuela on the southern cone. If you can point me to some sources, please leave a comment below.
Book: Sustainable Materials with Open Eyes

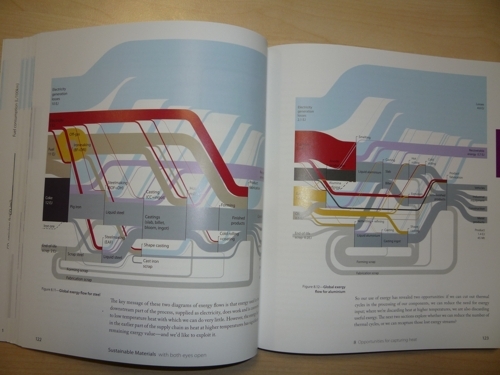
Following up to my Aug 25, 2011 post on Global Steel and Aluminium Flows, I would like to recommend the follwing book that has just been released: Sustainable Materials – with Both Eyes Open: Future Buildings, Vehicles, Products and Equipment – Made Efficiently and Made with Less New Material by Julian M. Allwood and Jonathan M. Cullen.

I’m hardly a hundred pages into reading, but I already love it. The book is very graphical (to say the least), well illustrated, with many graphs and photos, infographics and even historic images. Plus – and this is why it deserves to be presented here on the blog – it features a great number of Sankey diagrams.

I really enjoy the lego bricks in the steel making flow chart (pp. 121-127). You’re also going to love the ‘WhatsApp’-style chat between Henry Ford and the Wright Brothers (p. 181).

This book “faces up to the impacts of making materials in the 21st century. We’re already making materials well, but demand keeps growing and so we need to start using them well to.” (from the back cover)

Sustainable Materials with Open Eyes by Julian M. Allwood and Jonathan M. Cullen can obtained from Amazon and – I am pretty much sure – from your local book dealer. Here is the book’s website.

1939 Graphic Presentation Book

This post on the Visual Think Map blog (new addition to my blogroll) guided me to the fantastic 1939 book ‘Graphic Presentation’ by Willard C. Brinton. It is available in full as a PDF on archive.org.

The book with more than 50 chapters features literally hundreds of graphics…

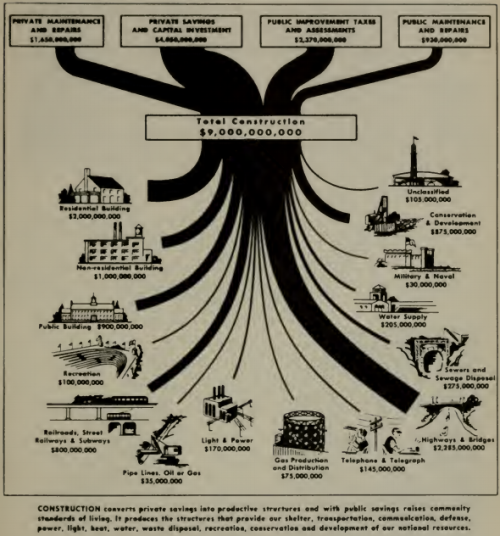
Chapter 8 (pp. 73 to 80) deals with “Flow Charts”, and has the above Sankey diagram on sources of funds and spendings in construction.

The chapter has an emphasis on ‘Cosmographs’ (a brand name at that time, apparently by IBM) and how they are made. I will dedicate one of the next blog posts to cosmographs I think. In the meantime, enjoy browsing Brinton’s book.