Tag: Canada

Sources and Beneficiaries of R&D Funding

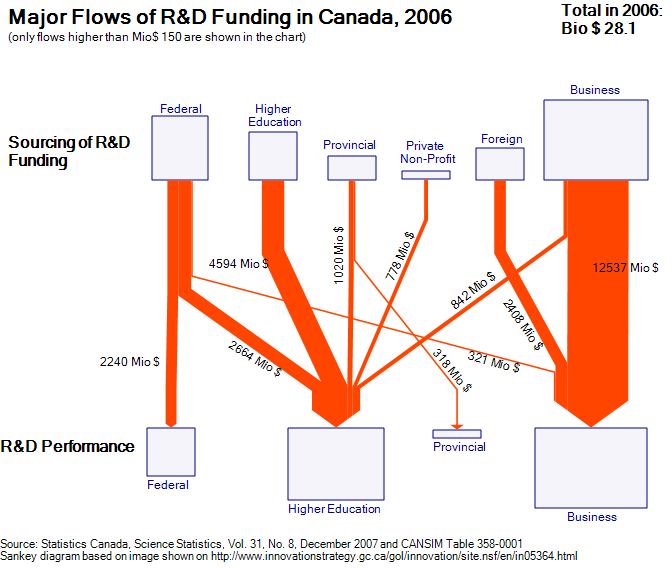
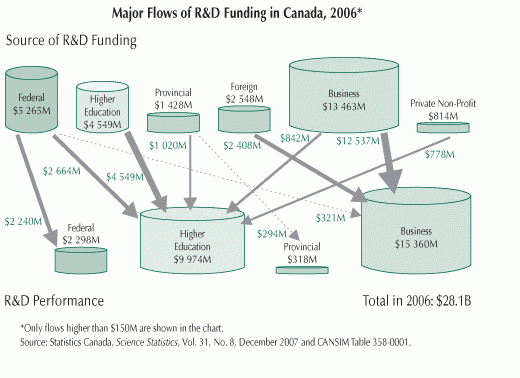
In early November I was pointed to an image on the Innovation Strategy Canada website [the website itself is not accessible any more] by a reader of this blog. Peter asked whether I know of any Sankey diagrams for financial flows, like they are shown in the one below.

The diagram visualizes the sources of R&D funding, and the institutions receiveing this funds. Data is from Statistics Canada for 2006 and shown in Mio (supposedly) Canadian Dollars.

While there are only four different arrow widths to show the financial flows, the interesting thing is that the sums of funds from each source and received by each beneficiary are shown as cylinders (database symbols, tanks, …).

I quickly did several versions of the diagram, but was not too happy with the results. The flow quantities are OK, but as it turns out, it is difficult to see the volume of the cylinder, supposedly to scale with the sums. This information is redundant anyway, since the width of the joined arrows at their base or at their head is exactly the sum that is supposedly to be shown by the cylinder volume.

Here is one version of my Sankey diagram for R&D funding in Canada for 2006 based on the original image. I decided to make the boxes in different sizes (the problem remains the same: can one immediately grasp the area of each box).

Your comments are welcomed. Is there a better way to display the sums?
Canadian Energy Flows

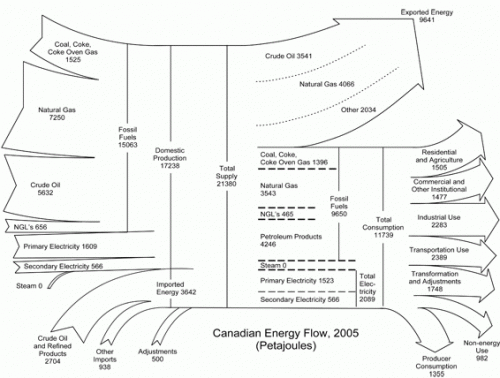
Statistics Canada in its “Report on Energy Supply-demand in Canada” for 2005 shows two Sankey diagram in the annex (HTML version of the two Sankey diagrams). They show the energy flows for Canada 2005 and 2004 in Petajoules per year.

I have featured similarly structured diagram for other countries here before: Japan, Scotland, Ireland, and the United States.

Out of 21380 PJ of total energy produced in Canada and imported, some 9641 PJ (45%) are exported, while 11739 PJ (55%) are national consumption. If you have the impression that the proportions are not 45:55, you are right, they are more like 39:61! From a graphical perspective this Sankey has more peculiarities worth a mention: the magnitude of the Sankey arrow changes and just before the arrow head they become narrower. The flows labeled “Steam” and “Adjustments” seem to have been added at a later stage as they don’t merge into the other arrow. Steam is represented on the production side as well as in the breakdown of energy carriers with a small, but not unsignificant width, however the quanity is given as zero.

Materials Accounting and Mass Balances

Environment Canada in 2001 published a Pollution Prevention Planning Handbook, a 153 page guidance manual on processes and techniques for pollution prevention. Update: The original handbook has been removed. Sucessor pages have been put online, and can be found here.

In appendix B of the handbook materials accounting and mass balances are presented as one technique. The text states that

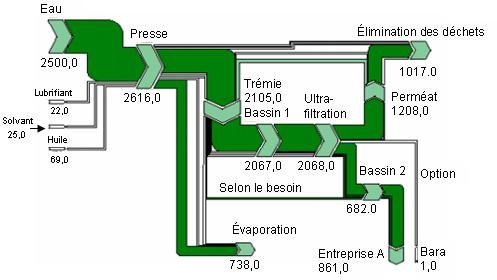
materials accounting and materials mass balances can be presented in a tabular or diagrammatic format. A Sankey diagram provides one useful method for representing a picture of material flows and balances.

and a sample Sankey diagram is shown.

Although not all quantities of the individual flows are shown, and there is no reference to the unit used, I think this is a fine example of using Sankey diagrams. The mass imbalance at the first process “Presse” (at the very left) is clearly visible. From the neighboring downstream processes you can see that at least 2105 units (to “Trémie”) and 738 units (to “Évaporation”) leave the process, that has inputs of only 2616 units. The diagram was made with S.Draw.