Tag: carbon

Québec Energy Flows and CO2 Emissions

The CESAR (Canada Energy Systems Analysis Research) blog at www.cesarnet.ca had been idle for a while, but reopened 2015 with a post on Québec’s energy flows and related carbon dioxide emissions.

The post ‘The State of Energy in Quebec – 2015’ features two Sankey diagrams originally from a report in French language ‘État de l’énergie au Québec’ by HEC Montral (PDF here). Benjamin Israel is the author (should I say artist?) of these Sankey diagrams.

The first Sankey diagram is on Québec’s energy flows in 2012. Flows are in petajoule (PJ). 1 petajoule is described for everybody to understand as “(278 GWh) corresponding to the energy consumption of approximately 10.000 households in Québéc.”

Four columns give a structure to the diagram: energy sources, transformation, use, efficiency of the system. The upper part depicts energy produced in Quebec (“Énergie Produite en Québec”). Energy sources are purely renewable: hydro, wind and biomass. The bottom part shows fuel imports into the province: petroleum, natural gas, uranium, coal. Grey arrows collect the losses. Interesting to see how losses from energy generation and refineries in column 2 dive beneath crossing bands to rejoin the other losses in column 4.

The second Sankey diagram (from p. 27 in the HEC document) is a summary of greenhouse gas (GHG) emissions (in French: ‘émissions de gaz à effet de serre’ short: GES) in Québec in 2012.

Given the information from the above energy diagram, where Québec domestic energy production is 100% from renewable sources, it is not surprsing to see that the carbon emissions are mainly from imported energy. Combustion of fossil fuels makes up for 57 of the total 78 Mt CO2-equivalent emissions. The remaining 21 Mt of CO2-equivalent emissions are from industrial processes, agriculture and waste.

Québec’s per capita GHG emissions ranges lowest with 9,7 tonnes of CO2-eqs compared to other Canadian provinces (see scale in lower left).

Beautifully crafted Sankey diagram. I hope to see more on the CESAR blog in the future.
CamU Climate Change Mitigation Research

A research group headed by Andrew Skelton and Sören Lindner at Cambridge University’s Centre for Climate Change Mitigation Research is “developing environmentally extended input-output models to assess greenhouse gas reduction across production layers and supply chains of the global economy.”

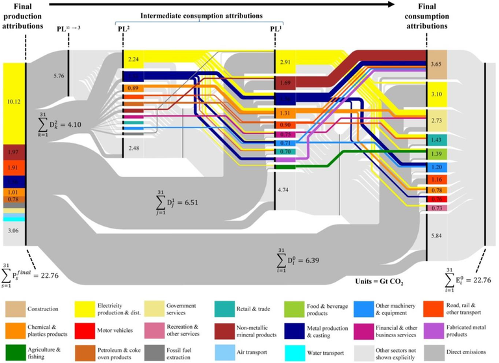
The figures on their webpage describing the group’s activities include this Sankey-style mapping of “flows of embodied emissions through the global economy [that] … help to visualise and explain … differences between production-based and consumption-based accounts of emissions”.

Unfortunately no high-res image is available. However, one can find the producing sectors on the left side (each of which identifiable by its own color) and their responsibility for a share of the 22.76 Gt direct CO2 emissions. On the right side one can see the consuming sectors and their use of input that has embodied emissions from the supply chain (two intermediate transformation steps in the centre).

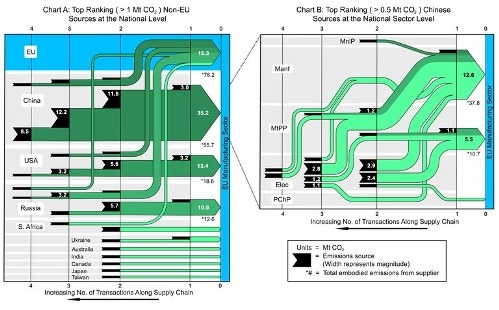
Additionally one can find these two diagrams for embodied emissions from supply chains. The left one is for all major non-EU sources, the right one a breakdown for products and intermediates sourced from China.

Data is based on input-output (IO) statistics and Life Cycle Assessment (LCA). An interesting topic and a good use of Sankey diagrams IMHO. Read more on the research web page that also has links to the scientific publication made by the group.

Energy Sankey for UCL Campus

The company with the catchy name ‘Useful Simple Projects‘ is “a design led consultancy [that works] with organisations and on major urban development projects to develop sustainability strategies, and identify opportunities for innovation”.

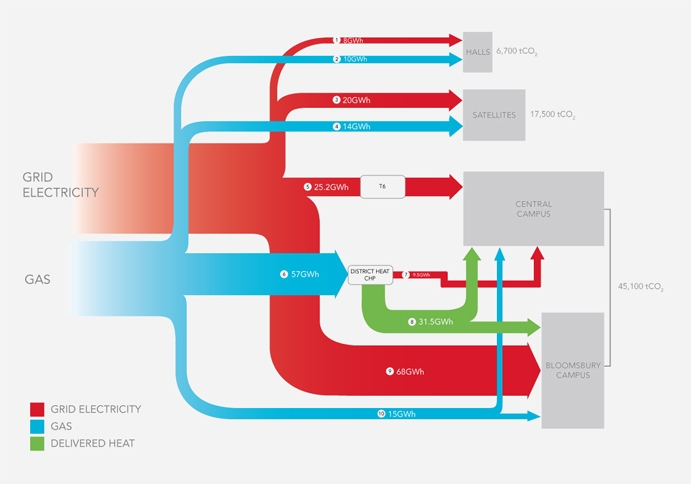
Here is a Sankey diagram they did for an energy strategy study for University College London’s Bloomsbury Campus.

Values are probably for a year. The Sankey diagram shows energy consumption in GW (red and blue arrows). The UCL campus has a cogeneration plant, so heat (green arrow) can be produced and distributed by district heating grid.

The numbers in grey show the carbon emissions in tons of CO2 linked to the energy consumption (most likely using characterization factors for electric energy production in the UK and for provision of natural gas). UCL has a low carbon strategy for the next years and this study helps them to review their goals.

This Sankey diagram is … simple and useful.