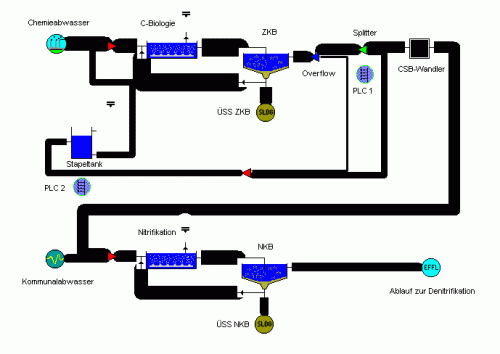
This Sankey diagram shows COD (chemical oxygen demand) in a waste water treatment plant that handles both municipal waste water as well as effluents from a chemical plant.
It was generated using the software package STOAT, which allows for dynamic simulation of wastewater treatment plants. Image with kind permission of Berlin-based EnviaTec GmbH.
The Sankey diagram does not show any flow quantities explicitly, and the values seem to be clustered into five or six fixed arrow magnitudes. The flows have a flat arrow base, and a rounded arrow head, which is uncommon, but still let’s you determine the flow direction. Process clipart icons overlay the nodes, where flows branch off or merge.
I have added the STOAT model to the list of software tools with Sankey drawing capabilities.
