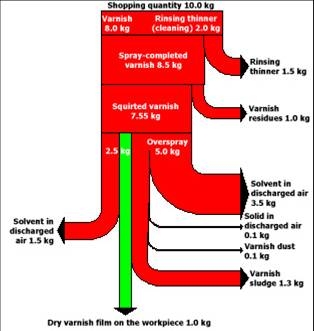
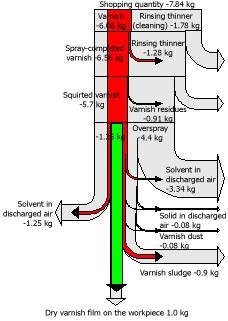
Found the following Sankey diagrams in an educational presentation by UNIDO on Cleaner Production (CP).
This is actually quite a nice idea to show the improvements resulting from a technical measure. The diagram on the left represents the original situation, while on the right it is seen in grey. The flow diagram for the new situation overlays the “old” diagram. Both are scaled to 1 kg of varnish applied to a workpiece (the green Sankey arrow), so the reductions in input quantity and emissions show the actual savings achieved.

