Tag: CRMs

Handling Different Scales in one Diagram

Those of you who have already created Sankey diagrams might have come across the issue: As long as the flow data you are about to visualize is more or less in the same value range everything is fine, and there should be no problem in coming up with an nice Sankey diagram. However, sometimes we have very small flow quantities, while at the same time there are some large flows dominating the picture.

Sticking to the “golden rule” of Sankey diagrams (i.e. the width of the Sankey arrow corresponds to the flow quantity represented) and ensuring the proportionality of flows in relation to each other becomes very difficult. If you opt to show the larger flows at “normal” width, the smaller flows become difficult to perceive and are shown as hairlines (sometimes even invisible on a screen or in print). If, on the other hand, you decide to push up the scaling factor so that these smaller flow quantities can be seen in the diagram, then the large flows are really fat and spoil your diagram.

This seems to be an irresolvable issue… Nevertheless, there are some approaches to tackle this. Most of them resort to taking out the tiny flows or the very large flows of being to scale used in the Sankey diagram. You may opt to use a minimum width (e.g. 1 or 2 pixels) for arrows that carry only a small flow quantity, or you may decide to set an upper flow threshold, corresponding to a maximum width for the Sankey arrow, independent of the actual flow quantity (beyond the threshold value). In both cases I would strongly recommend to denote this decision in the diagram (e.g. in a footnote), since otherwise the person looking at the Sankey diagram will get a wrong idea of the quantities/proportions.

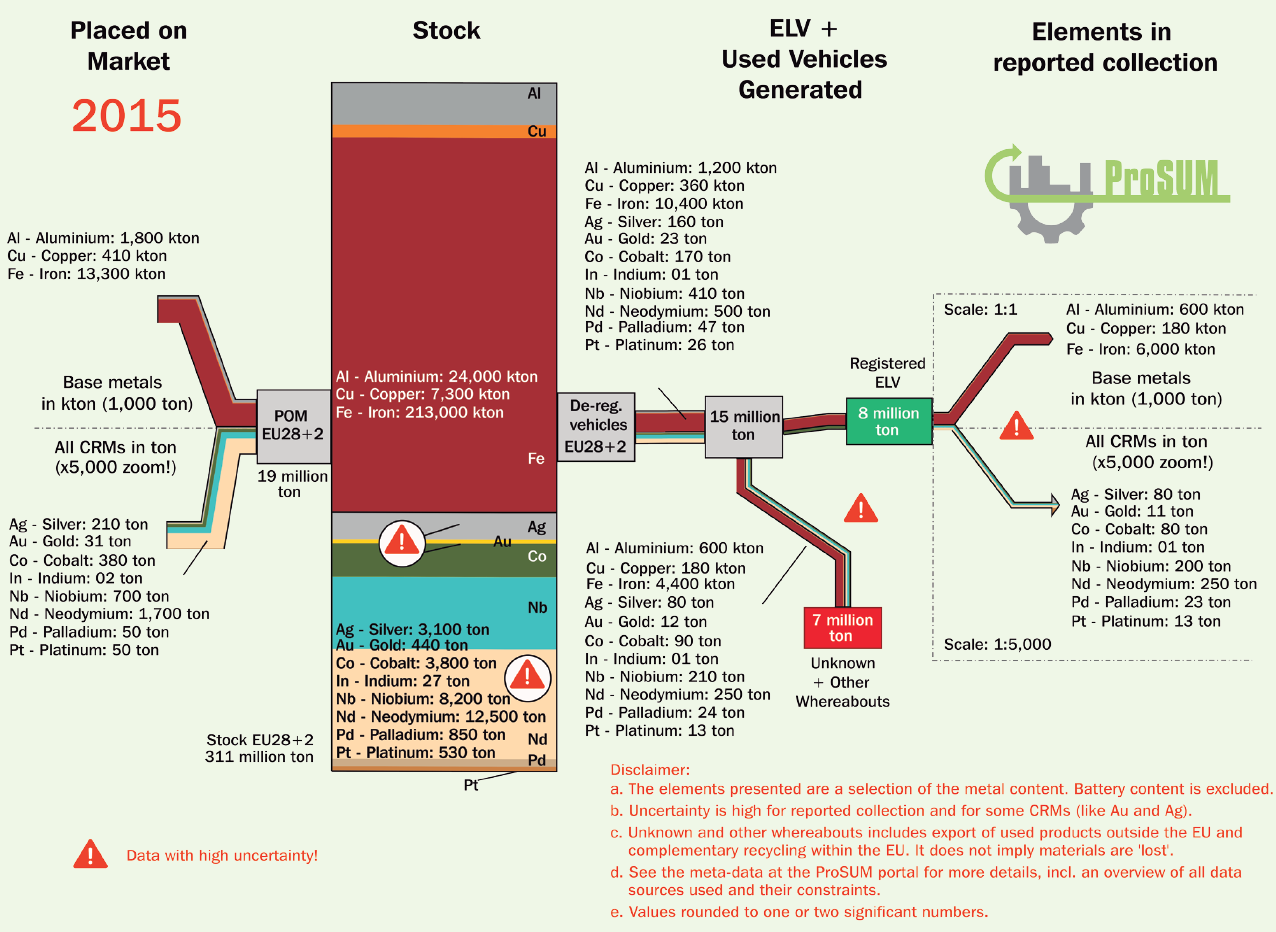
The Sankey diagram from the PROSUM report I recently featured in this post has another, quite unique solution. Here is a zoomed cropped section:

The metals in the end-of-life vehicle (ELV) stream of 8 million tons (in 2016) are mainly aluminium, copper and iron. This stream is on the same scale as the overall Sankey diagram (see full diagram here). However, the other metals in the stream (such as gold, silver or platinum) are contained in comparatively much smaller amounts. The authors of the Sankey diagram hence opted to emphasize them by switching to another scale (1:5.000). As a result the arrow representing the flow of approximately 660 tons of critical raw materials (CRMs) is almost a wide as the arrow that shows 6780 ktons!

The fact that the precious metal stream is highlighted and not to scale with the rest of the flows in the diagram is clearly signalled with a note, a dotted line that separates this diagram area, and even an exclamation mark symbol.

Since CRMs were the focus of the PROSUM study I think such a “trick” is justified. What are your experiences with flows on different scales? How would you handle this “dimension challenge” in a Sankey diagram? Let me know your ideas!

Precious Metals and Critical Raw Materials

The EU funded PROSUM research project looks at ‘Prospecting Secondary raw materials in the Urban mine and Mining wastes’. The more than 15 institutions participating in the project have recently published their findings in a final report.

The report has some interesting Sankey diagrams on market input, stocks, waste generation and waste flows for product groups such as vehicles, batteries, precious materials and selected critical raw materials (CRMs) contained in batteries, electrical and electronic equipment (EEE) and vehicles.

Here is the diagram for vehicles in the EU28+2 (=EU28 plus Switzerland and Norway) market. Data relates to the year 2015.

Flows are in tons and ktons, blending two scales in one diagram. This merits its own post, I think. (read it here)

The electric vehicles currently driving on the roads are shown as “Stock”, meaning that the materials are in use and that they could eventually be recovered at the end of the life of the vehicle. This is the large stackd bar between “POM” (placed on market) and “De-reg Vehicles”. Again this stacked bar uses two different scales (tons and ktons).

Official report citation: Jaco Huisman, Pascal Leroy, François Tertre, Maria Ljunggren Söderman, Perrine Chancerel, Daniel Cassard, Amund N. Løvik, Patrick Wäger, Duncan Kushnir, Vera Susanne Rotter, Paul Mählitz, Lucía Herreras, Johanna Emmerich, Anders Hallberg, Hina Habib, Michelle Wagner, Sarah Downes. Prospecting Secondary Raw Materials in the Urban Mine and mining wastes (ProSUM) – Final Report, ISBN: 978-92-808-9060-0 (print), 978-92-808-9061-7 (electronic), December 21, 2017, Brussels, Belgium

Europe JRC Critical Materials Report

Europe’s Joint Research Centre (JRC) has published a new report on ‘Critical Raw Materials and the Circular Economy’ in December 2017.

The report also builds on findings from a 2015 study by BIO by Deloitte, where a Raw Material System Analysis (MSA) Framework had been introduced that “investigates the flows and stocks of 28 raw materials from ‘cradle-to-grave’, that is, across the entire material life cycle from resource extraction to materials processing to manufacturing and fabrication to use and then to collection, processing, and disposal/recycling”. I had posted about this here.

Like in the 2015 study the authors present MSAs for a number of critical materials (CRMs) within the EU-28 boundaries and are depicting them as Sankey diagrams. The authors then expand into how scarcity and price may impact certain industrial sectors or products (Automative, Electronics, Batteries, etc.). Best practices are suggested for recovering critical materials.

Here is the MSA Sankey diagram for Germanium (from page 41 of the report):


All flows are in kilograms per the reference year 2012. We can see that roughly 80.000 kg of Germanium entered the EU in the year 2012, and 15.800 kg were made available on the secondary material market within the EU.

For the individual industrial sectors, another type of figure is presented. This breakdown of how much of the CRMs is used in a specific sector gives a better understanding of the dependency on certain CRMs.

This Sankey diagram (from page 39 of the report) for the Electrical and Electronical Equipment sector shows, for example, that 87% of the Germanium (ge) entering the EU are used in the EEE sector, making it the largest consuming sector of Germanium. The remaining 13% are used in other sectors:

Crossing the information from the MSA Sankey diagams that show availability of a CRM, and the information from the Sankey diagram showing demands per sector gives a good understanding on why some materials are considered critical for industries, and measures for recovering more of them from tailings or waste are meaningful.

Source: Mathieux, F., Ardente, F., Bobba, S., Nuss, P., Blengini, G., Alves Dias, P., Blagoeva, D., Torres De Matos, C., Wittmer, D., Pavel, C., Hamor, T., Saveyn, H., Gawlik, B., Orveillon, G., Huygens, D., Garbarino, E., Tzimas, E., Bouraoui, F. and Solar, S., Critical Raw Materials and the Circular Economy – Background report. JRC Science-for-policy report, EUR 28832 EN, Publications Office of the European Union, Luxembourg, 2017, ISBN 978-92-79-74282-8 doi:10.2760/378123 JRC108710.

Access JRC report here (PDF).