Tag: energy loss

Engine Efficiency of Cars

The U.S. Department of Energy (DOE) is funding research projects that target the increase of efficiency of car engine.

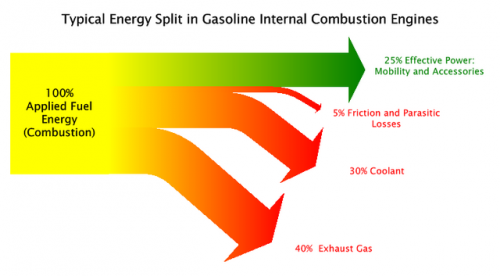
The Sankey diagram shown in this post on the Green Car Congress blog visualizes that only 25% (green arrow) of the energy from combustion is used as “effective power” for mobility and accessories, while 40% of the energy is lost in exhaust gas.

Projects are being carried out at John Deere, Caterpillar, Detroit Diesel and Mack Trucks, to name just a few.

“Seven of the twelve projects focus on advanced combustion technology with a heavy focus on HCCI (Homogeneous Charge Compression Ignition). There is also an diesel-compressed-air hybrid truck powertrain under development. The remaining projects deal with technologies to convert waste heat from engines to electrical or mechanical energy.”

The inefficient energy use of car engines and other vehicles are the main reason for the transport sector being (next to energy generation and transmission) the sector where most energy is being lost (see this post).
A Sankey for Energy Generation in the U.S.

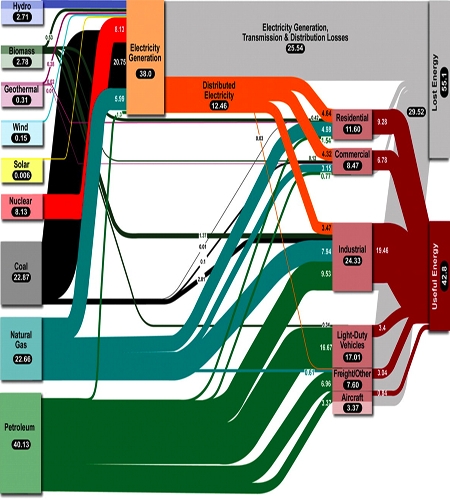
Joshua Rosenau over at scienceblogs took up on the energy topic in his ‘Thoughts from Kansas‘ and presents a Sankey diagram for the U.S. energy distribution (The Problem of Energy Generation) from an article in Science (Whitesides and Crabtree: Don’t Forget Long-Term Fundamental Research in Energy, Science 9 February 2007:Vol. 315. no. 5813, 796-798). It shows that more than 55% of the energy produced is lost, mainly in transmission and distribution on the grid (approx 25%) and another 30% in transport-related combustion of petrol [Note to self: do a Sankey diagram comparison for 1911 race car and modern light vehicle].

“…over half of the energy produced for our domestic market goes to waste. Fully two thirds of the energy produced by electrical generation and distribution goes to waste.”

This Sankey diagram shows the energy carriers on the left side, the sectors where energy is consumed (noteworthy: traffic has a larger share than industry) as midpoint groups, and a breakdown to useful and lost energy on the right.

Energy Losses in Industrial Ceramic Furnace

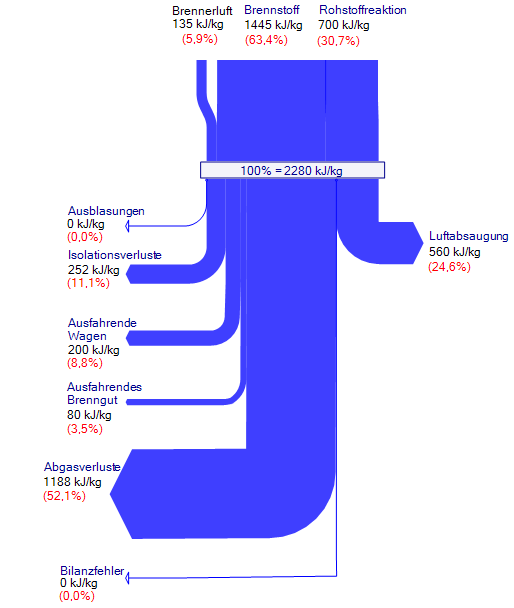
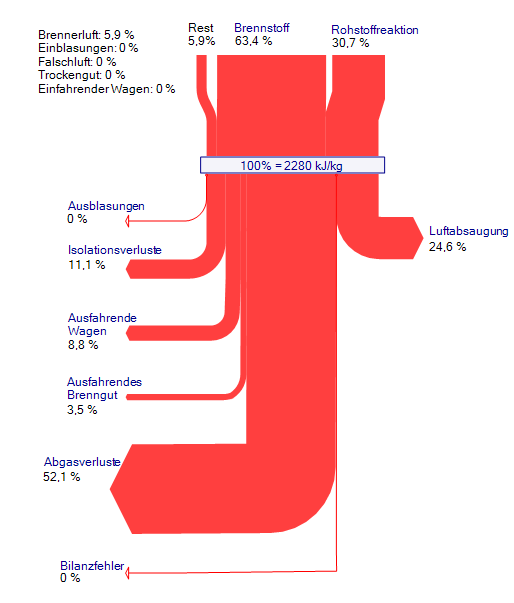
Here are two Sankey diagrams that show the energy losses in an industrial ceramic furnace. The diagrams are oriented top-down. The labels are in German.

The Sankey diagram in blue shows the energy use in an industrial ceramic furnace. The flows are shown in absolute values and in percentage values.

The second diagram in red is similar to the blue one, but it only show the relative flows in percentiles. Additionally the flows entering the diagram at the top have been separated to show their shares. Other flows (‘Rest’) have been grouped together and the individual contributions are shown on the label.