Tag: energy

Energy Flows in Wood Gasification Plant

Most Sankey diagrams I find on the web are from Germany, Switzerland or Austria. Anybody in the know, if this due to the visualization type being part of the engineering curriculae in these countries?

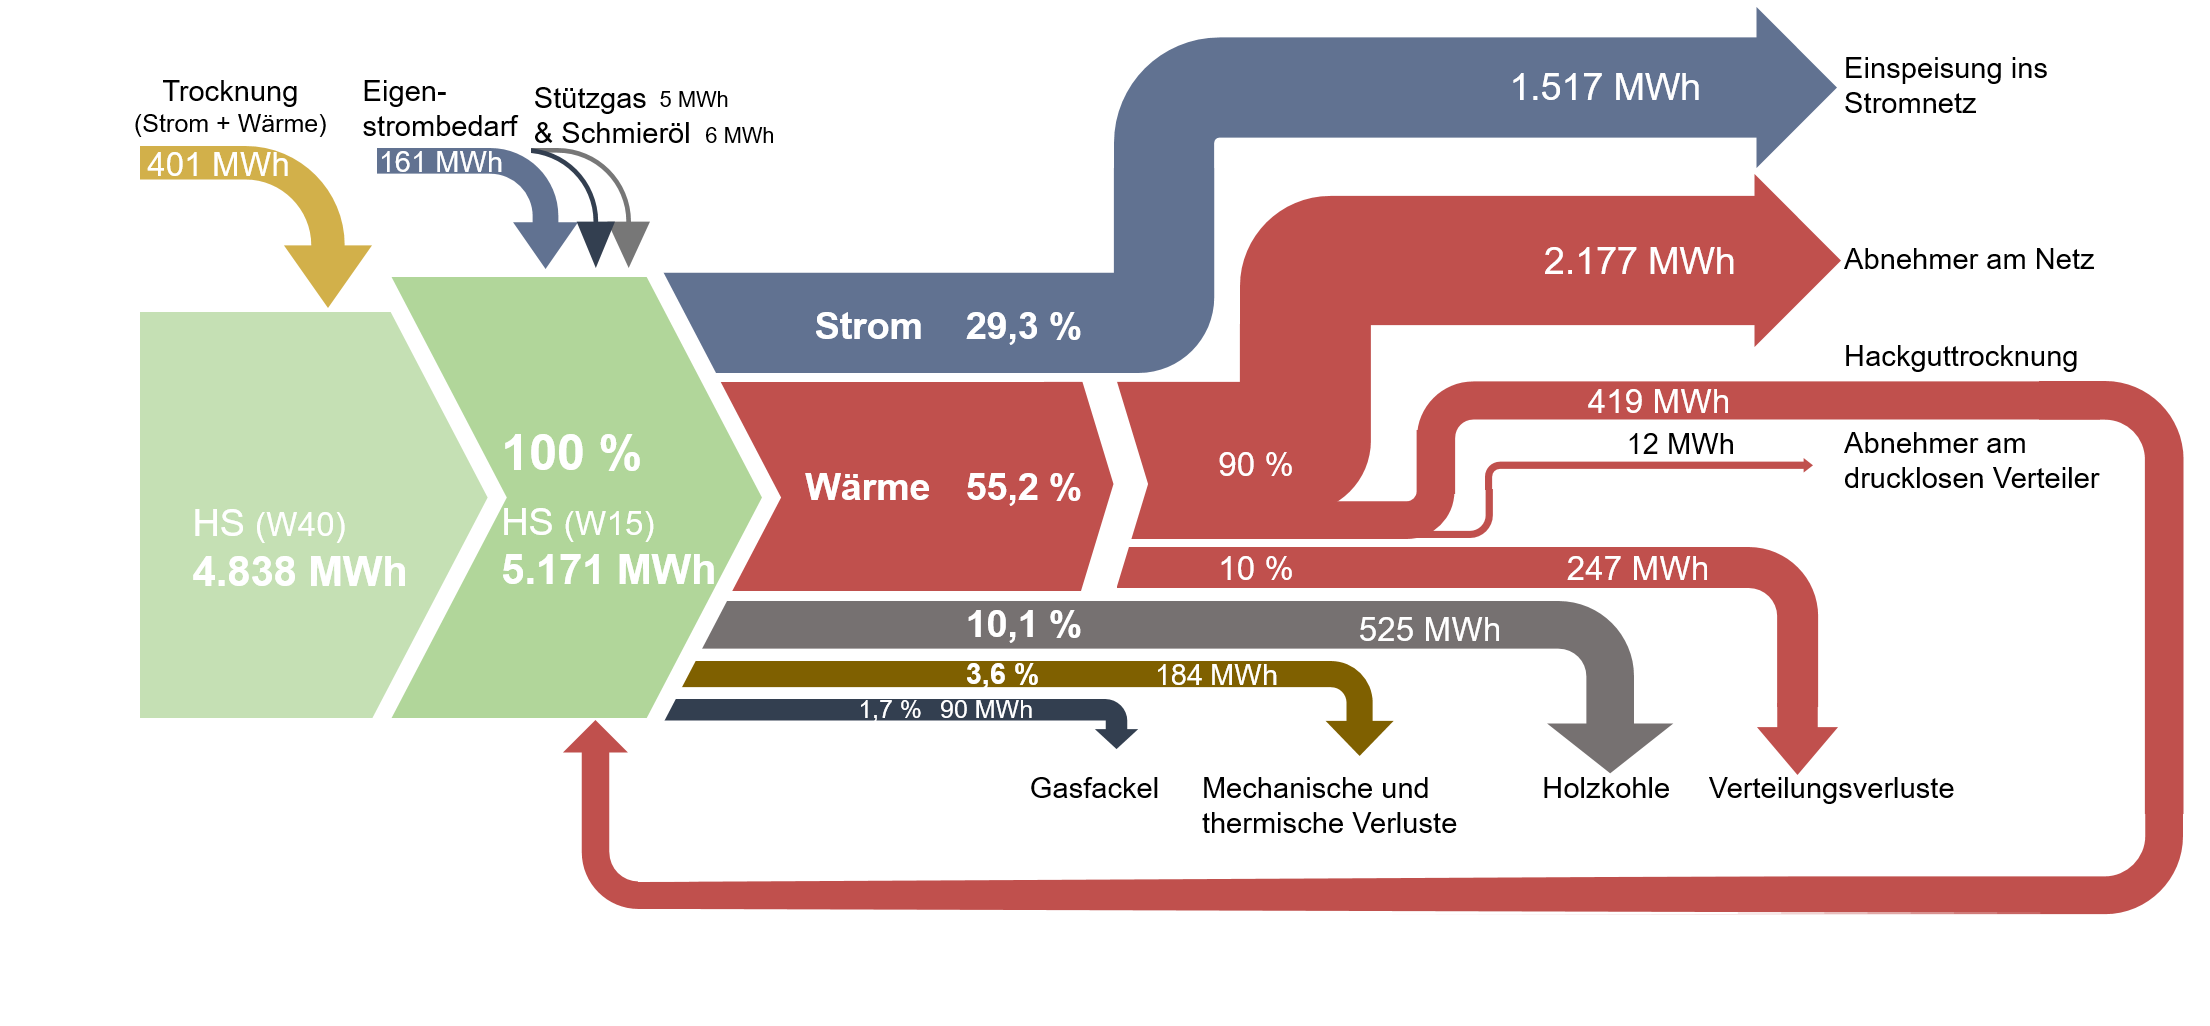
Here is one I found on ‘The Wood Power Plant’ blog by Austrian firm Syntec. It is originally taken from a student master thesis on ‘Life Cycle Analysis of Electricity and Heat Generation of a Wood Gasification Plant including District Heating Network’ (German title: ‘Lebenszyklusanalyse der Strom- und Wärmeerzeugung einer Holzvergasungsanlage inklusive Nahwärmenetz’, thanks Google Translate – you are my friend!) by Elena Käppler of University of Applied Sciences Vorarlberg.

While being graphically quite appealing there are some issue with this Sankey diagram. Flows don’t seem to add up correctly: for example the main stream 4.838 MWh and the 401 MWh coming in at the top would be larger than 5.171 MWh.
Also, some flows are not true to scale. Check out the red arrow representing 247 MWh (going down to ‘Verteilungsverluste’) and compare it to the red one going back in a loop, which represents 419 MWh (‘Hackguttrocknung’).
Swiss Sankey Sweetness

Unpretentious and humble, quietly producing beautifully crafted Sankey diagrams … this is one reason why I admire the Swiss (and also for their Swiss Schoki, cheese and engineering skills).

This is the energy flow chart for the Swiss canton ‘Basel-Stadt’ for 2014 published by the Statistics Agency of the canton (Statistisches Amt des Kantons Basel-Stadt).

Flows are in Gwh. Nine different energy sources on the left, but only three sectors of energy use: transport, residential and non-residential. Observe how the colors of the icons match the corresponding colors of the arrows. Flow quantities below approximately 150 GWh are not true to scale and are drawn with a minimum width to keep them visible. The footnote alerts the reader to this graphical pecularity.

This Sankey diagram does set a standard for other similar energy flow charts, in my opinion.

Download the report from here (in German), the diagram is on page 11.

Energy Flows in The Netherlands 2016

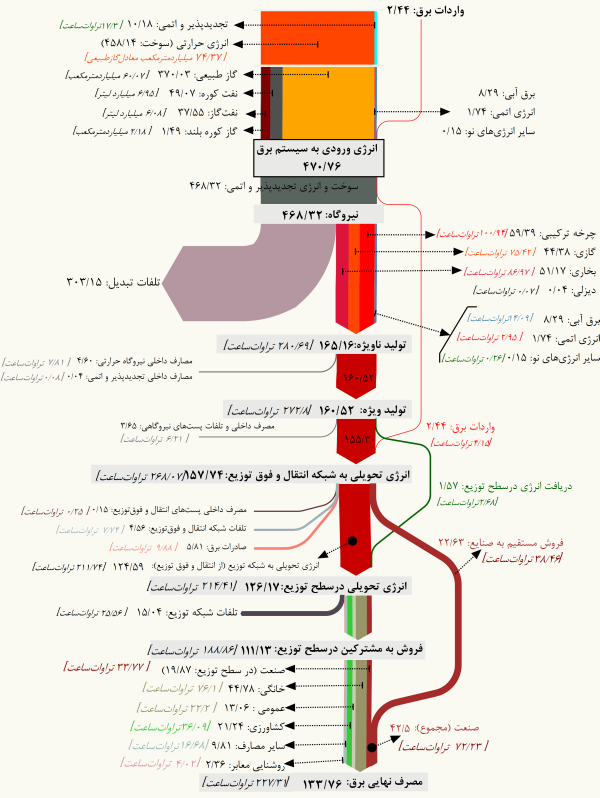
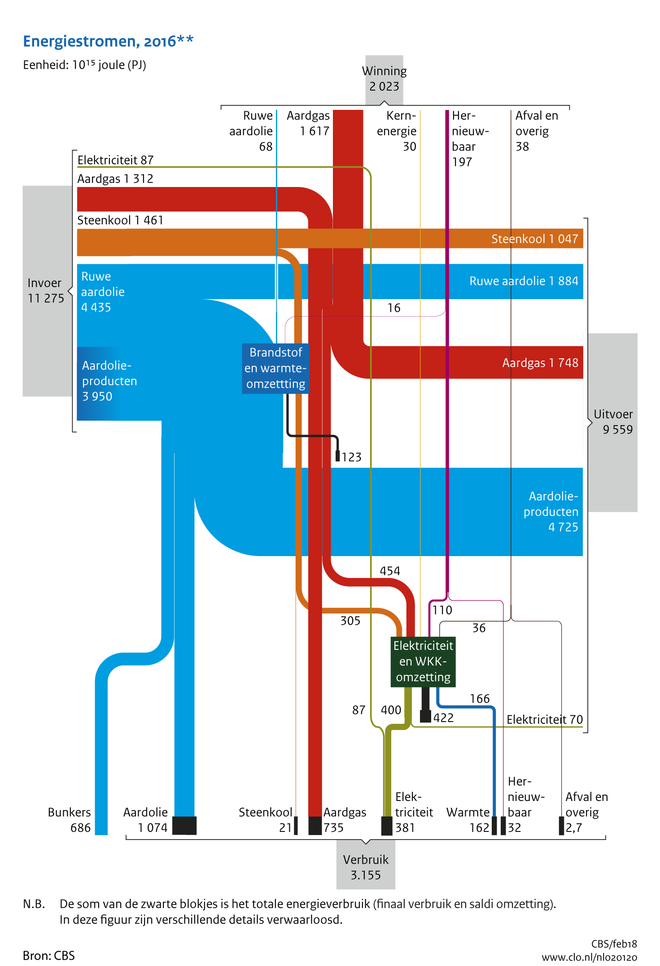
The below Sankey diagram depicting energy flows in the Netherlands in 2016 is very interesting. Actually it features two dimensions: energy production and consumption (from top to bottom) and energy imports and exports (from left to right). This is quite different from other national energy balances I have presented on this blog before (such as e.g. for Switzerland 2015, Chile 2015, Lithuania 2013, or Sweden 2014)

It can be found in the ‘Compendium voor de Leefomgeving’ (Environmental Data Compendium) a website run by the Dutch Government (Rijksoverheid) and is titled ‘Aanbod en verbruik van energiedragers in Nederland, 2016’ (Supply and consumption of energy carriers in The Netherlands, 2016).

Data for this Sankey diagram is from Centraal Bureau voor de Statistiek (CBS). Flows are in petajoule (PJ). Locally produced energy (‘Winning’) in 2015 was at 2.023 PJ, with a consumption (‘Verbruik’) of 3.155 PJ.
So, the Netherlands still had to import some 1.000 PJ to cover demand. However, it imported 11.275 PJ (‘Invoer’) and exported 9.559 PJ (‘Uitvoer’). In the first pace, the Netherlands seem to be an energy transit country. This is owed to the fact that Rotterdam is the largest oil port in Europe, and is a prime location for handling oil products (‘Aardolieproducten’).

Biogas in Auvergne-Rhône-Alpes region

The French region Auvergne-Rhône-Alpes in the south-east of the Hexagone borders with Switzerland and Italy. Lyon and Grenoble are located in this region, known for skiing, lush pastures … and great cheese!

Auvergne-Rhône-Alpes Énergie Environnement (AUR-EE) is a regional agency that works to bring together players in the renewable energy field and to promote RE projects.

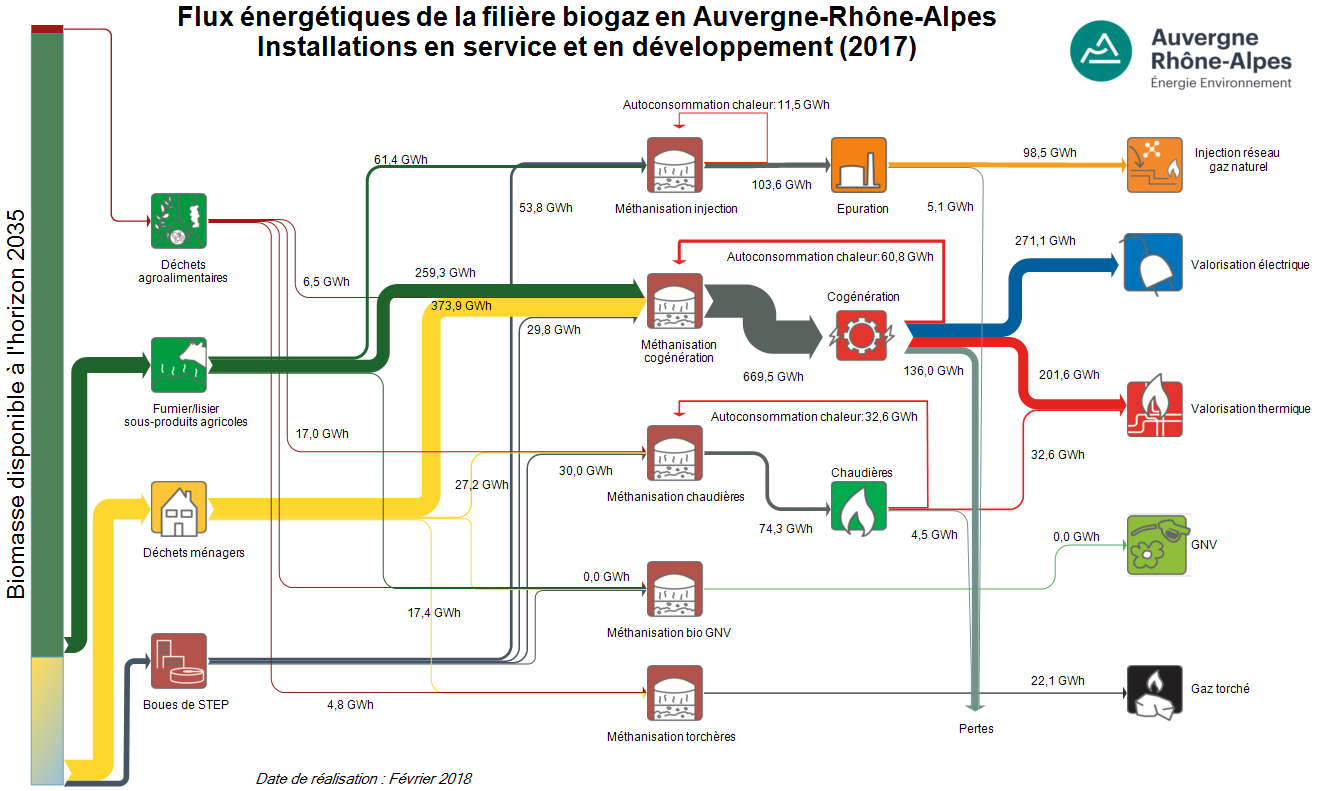
Given the agricultural character of Auvergne-Rhône-Alpes, biomass use for energy generation has been going strong in recent years. The agency has created energy flow Sankey diagrams for existing biogas installations, as well as a projection for the ones being under development.

Data is for 2017 and for the scenario where all projects currently under development would already completed. The yellow stream (‘déchets ménagers’) is household waste, providing 374 GWh of energy. Manure and other side-products from agriculture (green arrow) contributes another 260 GWh.
The stacked bar on the left hand side of the diagram indicates the potential availability of biomass by 2035, and one can see that only a small fraction of it is currently being taken advantage of.
Biogas is produced in anaerobic digesters (‘méthanisation’) and the region yields some 271 GWh electricity and 200 GWh heat per year from cogeneration plants. Already almost 100 GWh of biogas could be injected to the natural gas network, allowing for storage of the energy.

Note that smaller or even negligible flows are still shown with a minimum width in order to make them visible (these thinner arrows are not to scale with the others).

Energy Flows in ZeroCarbonBritain

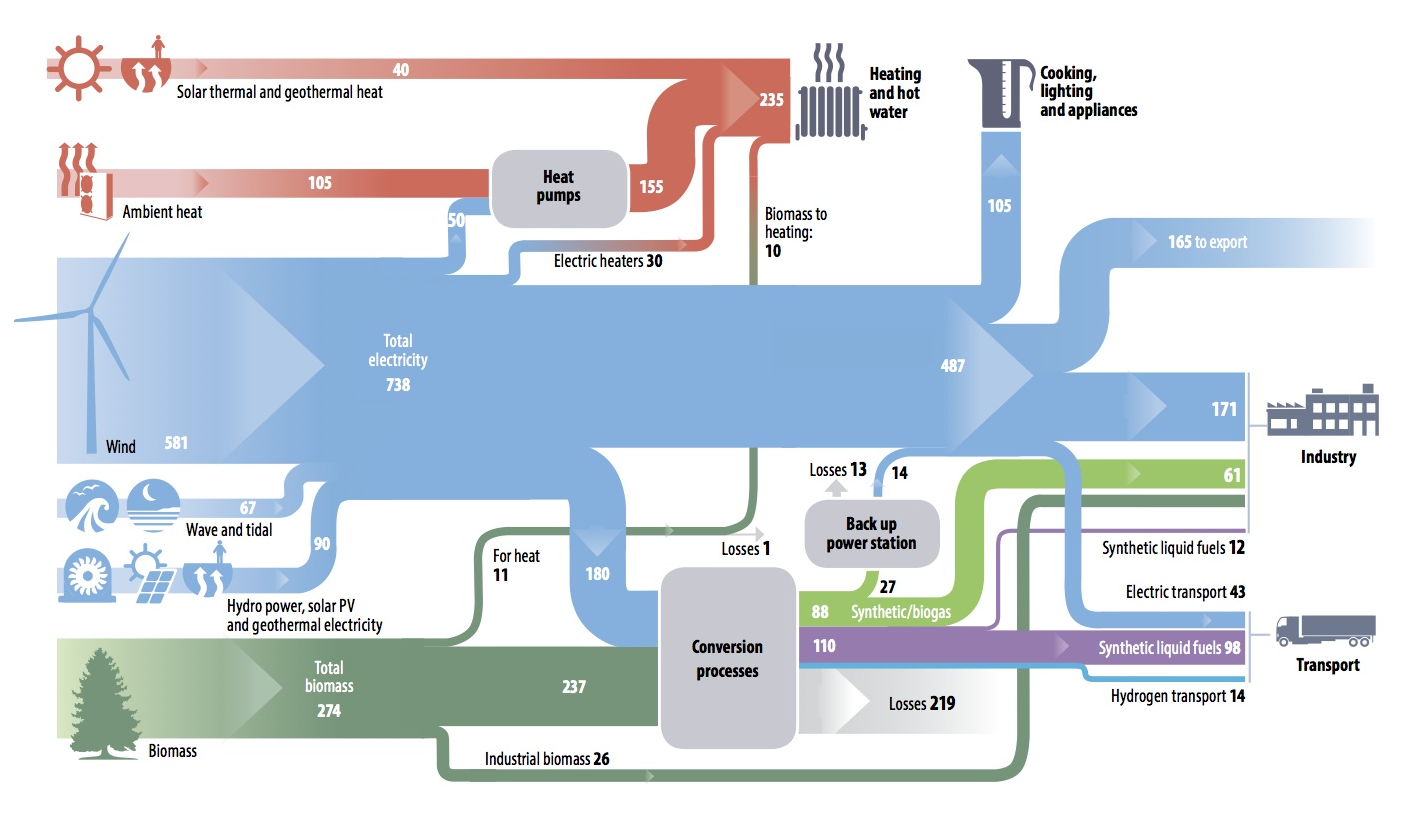
What would daily life in a ‘zero carbon’ Great Britain look like? Since 2007 the Zero Carbon Britain (ZCB) project of the Centre for Alternative Technology (CAT) has worked to “offer the hard data and confidence required for visualising a future where we have risen to the demands of climate science; to remove fear and misunderstandings and open new positive, solution-focused conversations.”

They have presented a Sankey diagram for the energy landscape in the UK, the way it could look like if Britain’s energy production was actually carbon free and 100% renewable energy.


via Open Energy Monitor blog, original image here (under CC BY-NC 2.0 license)

Flows are in TWh/year. The largest energy sources are wind and biomass. Some of the electricity is used to produce synthetic gas, synthetic liquid fuels and hydrogen (used mainly in the transportation sector). In that scenario there is even an electricity surplus that can be exported.

While I can not judge how realistic such a vision of the UK energy landscape is, I can at least say it is very different from the current situation (see here or here), and even from this UK 2050 energy scenario.

Stuttgart City Energy Flows

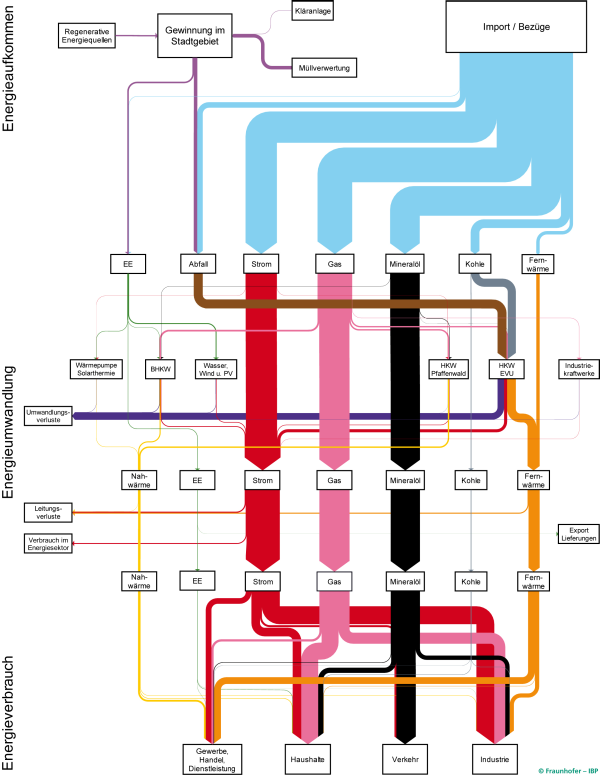
The energy balance of the German city of Stuttgart has been mapped as a Sankey diagram.

This was part of the project ‘SEE Stuttgart’ (City with Energy Efficiency / “Stadt mit Energie-Effizienz”) and has been developed by Fraunhofer IBP research institute.

A vertical layout was chosen. Absolute energy flow quantities are not shown in this version of the diagram, but are available in the underlying study. In 2010 primary energy consumption in Stuttgart was 20.300 GWh.

The diagram is used to promote a better understanding of the consuming sectors in the city, and the types of energy used. The SEE project aims to reduce Stuttgart’s energy consumption by 20% in 10 years and to transition to non-fossil fuels.

Stuttgart has actually won a first prize in a competition for energy efficient cities in 2016. It is thus setting a benchmark for other German cities. The above Sankey diagram is featured in this promotional video (in German) [at 2:36] and also briefly in this video (in German) [at 0:48] by IBP Fraunhofer.

A high resolution version of the Sankey diagram can be found here.