Tag: energy

Abundance of Solar Energy

In most parts of Europe, Russia and Northern a partial solar eclipse is observed today. People can feel how temperatures drop and dusk seems to begin even though the day has just begun… Time to remember that the sun powers our planet.

This Sankey diagram from the GEA 2012 report (Global Energy Assessment – Toward a Sustainable Future, Cambridge University Press, Cambridge UK and New York, NY, USA and the International Institute for Applied Systems Analysis, Laxenburg, Austria) page 773 shows that the “amount of solar energy available on Earth (estimated at 3.9 million EJ/yr) is many times the present human energy use (~528 EJ in 2009)”.

DOE Energy Water Nexus

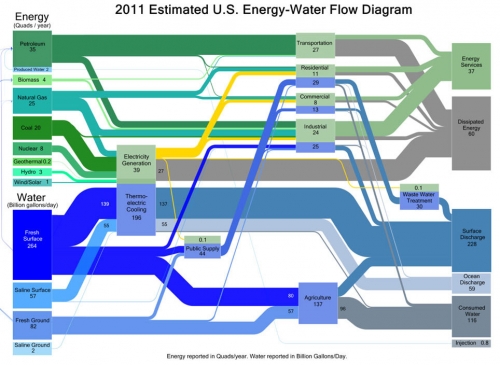
Via the EDF blog (no, not Electricité de France, but Environmental Defence Fund) comes this mixed Sankey diagram for energy and water flows in the U.S. in 2011.

Kate Zerrener explains in the post that energy generation and water consumption are deeply interwoven. The diagram shows which energy production and which consuming sector requires how much water.

“Water is measured in billions of gallons per day (BGD) and energy is measured in quadrillion British Thermal Units (Quads) per year. In the graphic above, water flows are represented in blue, energy in green.”

Energy Flow in Open Rack Vaporiser

The scientific paper ‘A Sankey Framework for Energy and Exergy Flows’ by Kamalakannan Soundararajan, Hiang Kwee Ho, Bin Su (Energy Studies Institute, National University of Singapore) features these two Sankey diagrams.

Energy flow in an open rack vaporiser (ORV):


Exergy flow in an open rack vaporiser (ORV):

The authors explain that “ORVs regasify liquefied natural gas (LNG) from temperatures below -160°C to room temperature through a heat exchange process with sea water at room temperature and pressure. (…) The Sankey representation of energy and exergy flows here presents a large potential for energy savings that could be realised in the regasification process.”

Energy Sankey Diagram for Nickel Production

The below diagram is shown in a short paper ‘A Sankey Diagram for Nickel Production’ by M. Levesque (School of Engineering, Laurentailn University, Sudbury, ON, Canada) and D. Millar (MINARCO, Sudbury, ON, Canada). The paper was presented at the ‘1000 Island Energy Research Forum (TIERF) 2011. It also appears on a poster on the same topic available on the MIRARCO website (large PDF!).

The diagram shows energy production, transformation and consumption in the Nickel production. This not only includes dryers, kilns and furnaces, but also supporting activities such as port handling and transportation.

No absolute values given in the diagram, and even the fuels are not specified (although you can identify what is probably hard coal, lignite, natural gas). Most likely a question of confidentiality. A left-to-right orientation of the diagram is presumed, and no arrow heads are shown. This could lead to an interpretation issue for the green band that leaves the power stations PS1 and PS2 vertically.

The paper concludes “The Sankey diagram highlights the areas in the process where focus is required for subsequent energy management effort.”

Non Process Energy Flow Diagrams

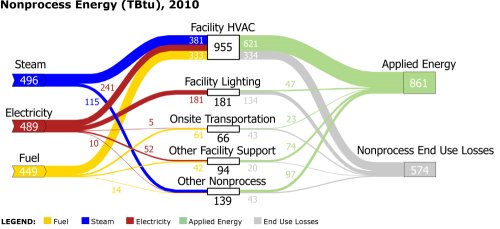
The U.S. Department of Energy (DOE), Office of Energy Efficiency & Renewable Energy publishes Sankey diagrams on non process energy on this webiste.

What is non-process energy you might ask. According to DOE, non process energy is “energy used for purposes other than converting raw material into manufactured product. MECS-specified categories of nonprocess energy include facility HVAC, facility lighting, onsite transportation, other facility support (e.g., cooking, water heating), and other nonprocess use.”

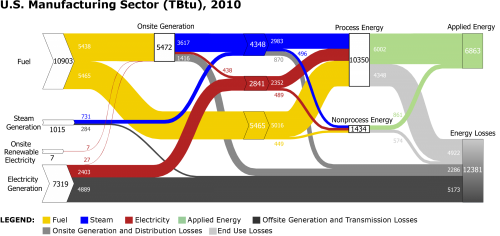
You can access the energy flow Sankey diagram for the full U.S. manufacturing sector. Data is from 2010 and flows are in TBtu (Trillion British Thermal Units) per year.

Detailed diagrams on on-site generation, process energy and non-process energy (the three ‘transforming nodes’ in the middle of the full sector) are also presented.

Grey and black arrows show losses. Good work from the Office of Energy Efficiency & Renewable Energy.

Energy Flows Romania 2008

I found the below Sankey diagram depicting Romania’s energy flows for 2008 in an article titled ‘A Macro-Micro Perspective on Sustainable Refurbishment of the Housing Sector’ by Ovidiu-Horaţiu Teleche, University of Architecture and Urbanism, Bucharest. Published in Proceedings of 1st International Conference on Architecture & Urban Design, Department of Architecture (2012).

Flows are in ktoe (kilotons of oil-equivalents). Underlying data is from the Romanian National Institute of Statistics and Eurostat 2010. EPP is for ‘Electrical Power Plant’, CHP for ‘Combined Heat & Power Plant’, and DHP for ‘District Heating Plant’.
Note the small flow quantities where arrows are not to scale to be able to view them at all (minimum line width set to 1 or 2 px).

Energy generation is predominantly fossil (coal, petroleum, natural gas). Biomass is the most important energy source in the residential sector. The article doesn’t mention the reason, but my guess is on wood or peat “for preparation of hot water, cooking and direct burning in the stoves for heating” as mentioned in this article on biomass in Romania.

Where do Sankey diagrams work? Data Revelations

Interesting blog post by Steve Wexler of Data Revelations. Long article, long title: “Circles, Labels, Colors, Legends, and Sankey Diagrams – Ask These Three Questions”.

The really interesting part for the Sankey diagram aficionados is Steve’s advice on when to use Sankey diagrams, and when you should avoid using them.

Steve illustrates his point with the below example by ‘Music Major – Data Miner’ Jeffrey A. Shaffer (original post is here)

A combination of a stacked bar chart with a distribution diagram, nicely decorated with a trumpet … “Within this context, this very creative chart works”, Steve writes.

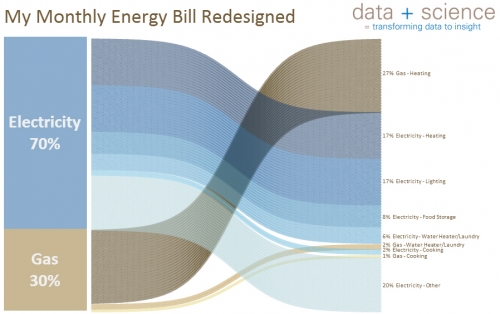
He then goes on and shows another one by Shaffer, also a distribution diagram: the original pie chart data from an energy bill has been redesigned and was presented as a distribution diagram (two stacked bars with bands to link them)

In this case, Steve concludes, the choice of a Sankey diagram is maybe not that wise, since the actual important information (44% of energy cost is for heating) doesn’t really come across quickly and clearly. A bar chart might work better here. Sankey diagrams can create a “cool!” or a “crap!” response, depending on the context. See the original Shaffer post here.

Adding my 2c from a technical perspective I would say that both diagrams have a shortcoming: The bands don’t maintain their width as they cross over the others diagonally. Somewhat acceptable in the trumpet diagram as the right bar on the right side listing the music composers is higher than the one at trumpet bell (sound spreading out). Not acceptable in the second diagram where the two stacked bars have the same height. This is obviously an error in the curve radius calculation (read ‘The Math Behind those Curves’)