Tag: house

Water Balance (or: Metabolic Profile Sankey)

This article on “Conceptualizing the built environment as a social-ecological system” by Sebastian Moffatt (CONSENSUS Institute) and Niklaus Kohler (University of Karlsruhe) published in Building Research & Information, Volume 36, Issue 3 May 2008 , pages 248-268 has an exciting Sankey diagram in the section ‘Current perspectives, promising methods, missing pieces’ (scroll down about half way).

The authors explain Sankey diagrams as an instrument of Material Flow Analysis (MFA)

“Sankey (directional flow) diagrams are often used to summarize the MFA visually as an entire connected and balanced system. In a Sankey diagram the material flows begin with inputs from nature, then flow into intermediary processes (any infrastructure used for processing, converting, storing, or regulating), and then into the various end use(s). After use, flows may be reconverted by infrastructure systems for reuse or recycling. Ultimately, all flows are directed to a category of output (waste products emitted into air, into water bodies or into landfills; long-term storage; export). The balanced accounting thus tracks every flow from source to sink.”
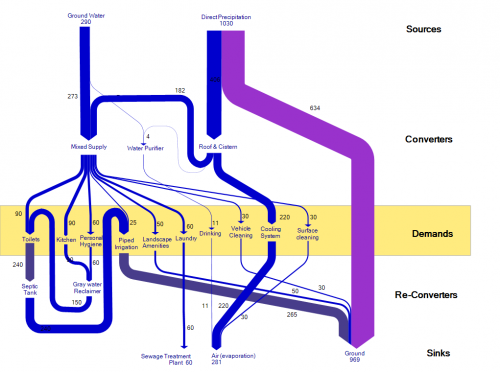
The original Sankey diagram shown in this article is for an resource efficient house, planned or built in New Delhi (India). It sports the water flows through five groups of processes (sources, converters, demands, re-converters, and sinks). The authors call it a “five-partition metabolic profile”, and suggest that it can be done not only for a single house, but “for the built environment at any scale, from parcel to urban region”.

The unit for the quantities given is not indicated, but I presume the water flows are in litres.

When reproducing the Sankey diagram (see above) I tried to make it a little more clearer by changing the order of the (invisible) nodes, thus avoiding crossing flows.
Software: Energy Flow Sankey for Private Homes

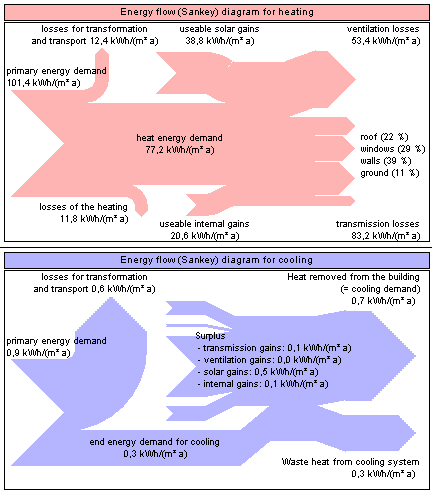
A software with a Sankey diagram feature that I hadn’t noticed before, and only now have added to the list of Sankey Software tools is CASAnova (new house). From what I understand this freeware tool was the result of a research project at a German university that ran from 2000 to 2002.

The program ‘CASAnova – An Educational Software for Energy and Heating Demand, Solar Heat Gains and Overheating Risk in Buildings’ is designed for an easy-to-use handling in order to get an intuitive understanding of the relations between building geometry, orientation, thermal insulation, glazing, solar heat gains, heat energy demand, heating and primary energy as well as overheating in summer.

CASAnova can be used to enter numerous parameters for a building, such as geometry, window and wall areas and types, insulation, heating system, and climate data etc. The tool will eventually produce a generic Sankey diagram of energy flows as the one above. I have just installed it and played around a little bit only to get an impression. CASAnova is available in German and English. Recommended.

Bioclimatic Construction – mais oui, avec Sankey!

The French architecture company AMEO is specialized in construction bioclimatique. The term is probably best translated as ‘bioclimatic building’ … but sound much more chic in French!

The houses they build are made from environmentally sound materials (mainly wood, and other materials such as and cellulose-based materials) where ever possible. Local micro-climate is taken into account, and passive solar energy is used for heating.

Sankey Diagram for a Bioclimatic Building (Source: AMEO Architecture)
Used with permission of AMEO – Source: http://www.ameo-architecture.com

The company presents energy gains and losses and the advantages of the bioclimatic building to their customers using Sankey diagrams as the one shown above. Unfortunately two of the flows have no quantity indicator, and two of the quantity shown in the labels have probably been switched (see thin flow labeled 13779 kWh, but wide flow labeled 5850 kWh). However, I like this diagram for its simplicity.

Heat Losses of a Family Home

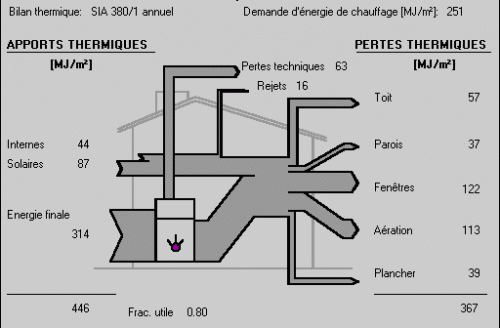
A few months ago I had found this b/w Sankey diagram on the website of the Institut de Génie Thermique (IGT) de la Haute Ecole d’Ingénierie et de Gestion du Canton de Vaud (HEIG-VD) in Switzerland, showing the energy or heat balance (bilan thermique) of an average family home.

It visualizes the sources of heat as Sankey flows into the building (in MJ per square metre) with the largest chunk being the combustible for the heating system, other inputs are from solar radiation and internal sources. On the right side it shows how and where heat is being lost: windows (fenétres) 122 MJ/m², ventilation (aéreation) 113 MJ/m² or roof (toit) 57 MJ/m². Also, the technical losses from the heating equipment (pertes techniques, shown as Sankey arrow from the heater to the top) are quite significant (57 MJ/m²).

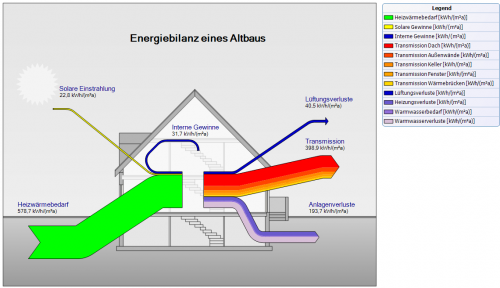
A similar Sankey diagram in German was presented on the e!Sankey forum recently.

This diagram submitted by one of their users is explained as follows:

In the diagram the group of flows in red colors are heat losses due to transmissions through walls, windows, doors, etc. The dark blue arrow shows heat loss through ventilation. The stacked purple/mauve flow represents heat losses at equipment and pipes.

While a little more detailed in the number of flows, it shows the same general situation: In many houses “a lot of the heat gets lost due to heat leaks (thermal bridges) or insufficient external insulation.”