Tag: metal

Australian Metal Flows

The Australasian Institute of Mining and Metallurgy (AusIMM) is an association of the minerals industry. In this AusIMM Bulletin article titled ‘From Waste to Wealth’ they talk about metal recovery and recycling in Australia.

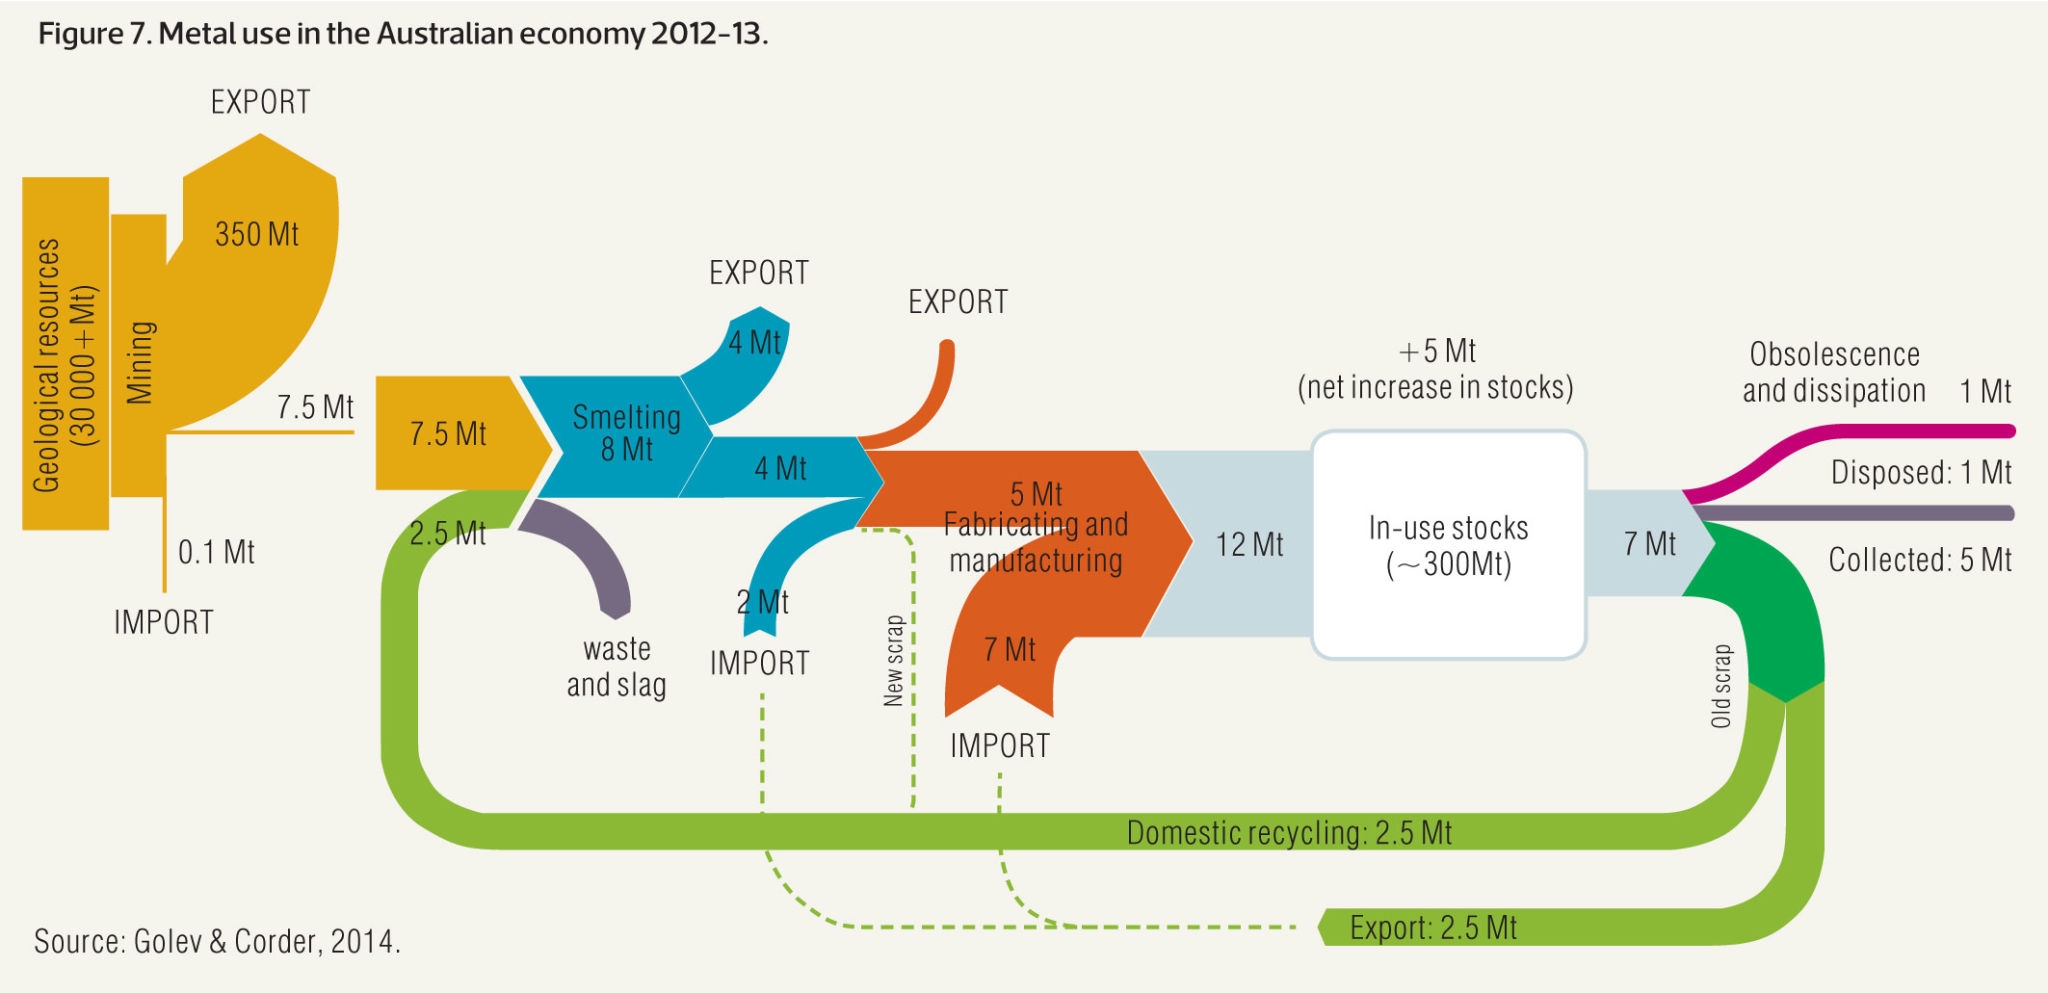
This Sankey diagram (actually two Sankey diagrams) from the article visualizes metal flows in Australia in 2012/2013 based on data from Golev & Corder (2014).

The smaller yellow diagram section on the left actually just shows mining activities in Australia and the fact that the largest portion of mining output (ores) are exported. Only 7.5 Mt are processed within Australia. This Sankey arrow is then blown up and corresponds to the yellow input stream into the second diagram [a similar solution to decouple diagrams with different scales was presented in yesterday’s post].

In the metal production process there are losses, and material is being exported and imported. The annual increase to the Australian ‘in use stocks’ (i.e. metals being used infrastructure, buildings and products) is 12 Mt, possible only thanks to 7 Mt metals imports. Some 7 Mt of metals are also released annually from ‘in use stocks’.

The dotted lines signal that there are possible routes, but either outside the scope of the Australian market or no reliable data is available (new scrap from the manufacturing step being fed back to the smelting).
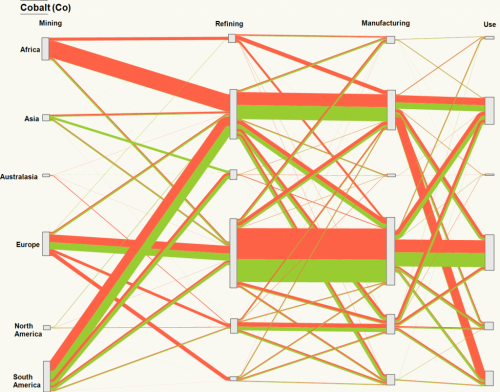
Cobalt Distribution Diagram by Continent

Happy New Year to all followers! Kicking off with a distribution diagram (aka ‘alluvial diagram’) for cobalt (chemical element ‘Co’) by the Geospatial Engineering Research Group at the University of Newcastle, taken from the article ‘Sankey diagram of cobalt life-cycle’ on their blog.

This shows the mining, refining, manufacturing and use stages for cobalt broken down by continent.

Not sure what the orange and green arrows stand for, or what the unit is. Also, there seems to be a mismatch between the input and the output quantitites at some nodes (check, for example, cobalt flows received from mining countries for refining in Europe compared to the deliveries to the manufacturing stage).
This could be due to mismatches in data from the different sources, or caused by changes in cobalt stocks (i.e. Europe mining and importing less but reducing stocks from previous year, thus being able to ship more to manufacturing in the same period). Maybe one of the authors wishes to comment?

Global Steel and Aluminium Flows

Checking further on the authorship of the Sankey diagram I presented in this post, I came to the LCMP website at the University of Cambridge. LCMP? Yes … Low Carbon and Metals Processing. The engineering research group around Julian Allwood and Jonathan Cullen have three large research themes: WellFormed, WellMet2050, and WellMade.

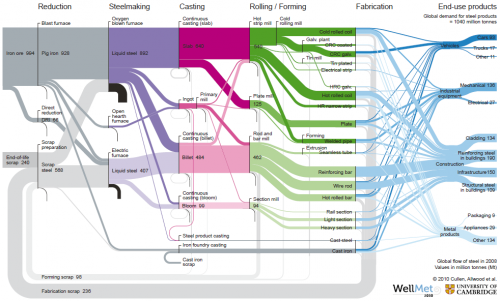
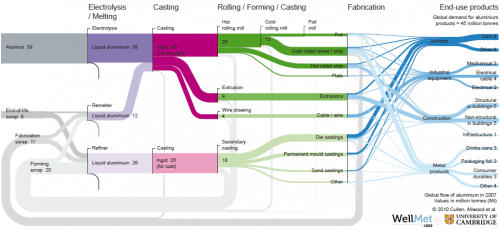
The below Sankey diagrams are from the report ‘Going on a metal diet’ by Allwood, Cullen et.al. published within the WellMet2050 research theme.

The first Sankey diagram shows the global steel flows in 2007

the other the global aluminium flows in 2007:

One page 7 of the report the authors explain

“In our maps, the width of each line is proportional to the mass flow of metal. Values for the major flows are given in Mt (million tonnes). Steel flows less than 1 Mt and aluminium flows less than 0.05 Mt are not shown. Each major process step is shown as a vertical black line, with three possible outputs: useful metal (colored), process scrap (grey) and metal losses (black). Useful metal continues to flow to the next process step, while scrap loops back to the appropriate melting stage where it is recycled. Internal recycling loops, for example from the continuous casting processes for steel are shown small oval loops. (…)The working papers … give more detail about creating the Sankey diagrams

Unfortunately these two mentioned working papers are not (yet?) available on the website. These really fantastic Sankey diagrams have been compiled from different data sources. I thought I’d share them with you. Please visit the LCMP website and read about their other exciting projects.

Exergy Sankey diagram

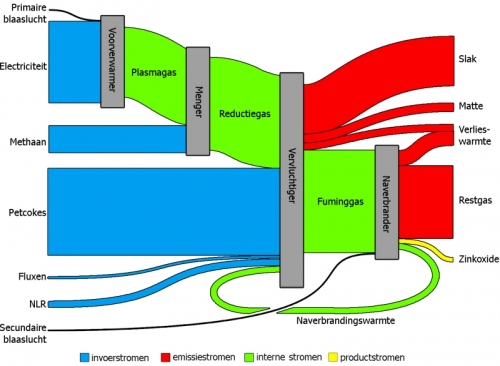
Found the Sankey diagram below in an article on ‘Exergetic efficiency analysis of pyrometallurgical processes’. It is from a master thesis by Bart Klaasen (PDF file), that contains several Sankey diagrams.

The main diagram is titled ‘Exergetic Sankey diagram for a zinc recycling process’. Input streams are in blue, emission streams are in red. Internal flows are colored green, while yellow represents the actual product.

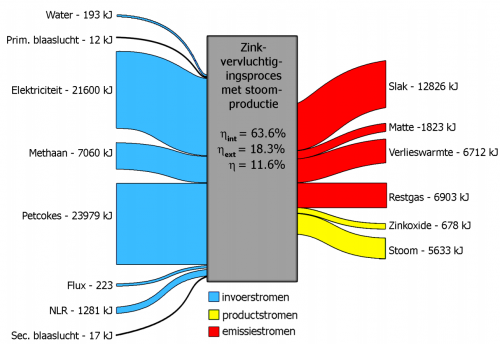
The flows don’t show arrow heads, but a general left-to-right direction can be assumed. No values in the above overall Sankey diagram, but for each process step individual input/output Sankey digrams can be found that feature exergy data in KJ. They look like this one:

In contrast to Sankey diagrams that represent energy flows, the input output flows into a process node don’t have to have the same magnitude. Exergy is synonymously called “available energy”.

“Energy is never destroyed during a process; it changes from one form to another (see First Law of Thermodynamics). In contrast, exergy accounts for the irreversibility of a process due to increase in entropy (see Second Law of Thermodynamics). Exergy is always destroyed when a process involves a temperature change. This destruction is proportional to the entropy increase of the system together with its surroundings.” (Wikipedia)

So it is understandable that the exergy represented by the flow magnitude at the output of the process is less than the one of the flows on the input side.

NB: Bart’s article reminded me of some bookmarks to exergy diagrams I have, will try to post these in the near future too.

Gold Flows in United States

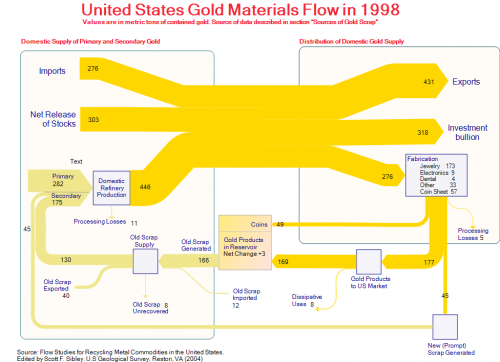
This Sankey diagram was posted as a sample on the e!Sankey Forum. It shows the gold flows in the United States in 1998. The original data is from ‘Flow Studies for Recycling Metal Commodities in the United States’ (edited by Scott F. Sibley. U.S Geological Survey, Reston, VA (2004)). Values are in metric tons of contained gold.

The left part of the diagram shows domestic supply of primary and secondary gold, as well as imports to the U.S., the right part distribution and use of gold. The U.S. is a net gold exporter. 318 metric tons gold bullion went to Fort Knox (presumably) that year. 276 metric tons were fabricated into products, mainly jewelry. At the same time 175 metric tons of new and old gold scrap were recycled. Along with the 282 metric tons out of primary production they are fed back into the production cycle.

The diagram has gold/light brown colored Sankey arrows that go along well with the topic. A text label has been forgotten in the left part.

More Merry-Go-Sankey Diagrams

After writing about VisioGuy’s radial Sankey diagram idea, I went through my bookmarks and collection of Sankey diagrams in search of further candidates for this special class of circular flow graphs.

Here are two goodies… 😉

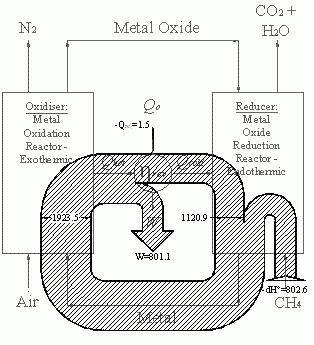
Below is a black/white Sankey diagram of energy fluxes in a chemical loop combustion cycle from an Imperial College website. It is similar to the radial one Chris designed, however it is not exactly circular. Not all of the entries and exits of the cycle are shown as Sankey arrows. The exit of the arrow labeled W is to the center (would one call this anticentrifugal?). The methane input makes a U-turn before entering the loop.

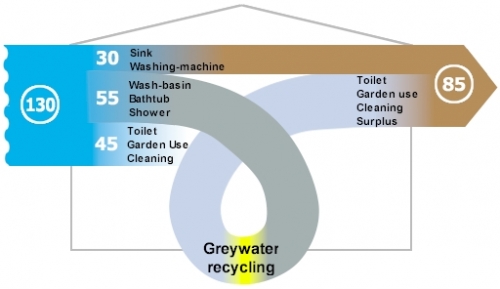
The other Sankey diagram is from this website of a U.K. based company, and shows greywater recycling. The average consumption of freshwater per person / per day in the UK was 130 litres in 1996.

The water from wash-basins, shower and bathtub could go through a recycling stage and be reused for flushing and watering the garden. The designer gave it a roller coaster style loop, which sure doesn’t add to the information content of the graphic, but immediately draws the reader’s attention to the recycling. I am not sure where the third flow coming from the right goes to. It represents the potential savings of 45 litres/day, but kind of disappears behind the loop.

I’ll post more of these as I come across them.

From Russia with Sankey…

Using e!Sankey myself, I am also a subscriber to the e!Sankey board, so that I get a toast message every time someone posts over there…

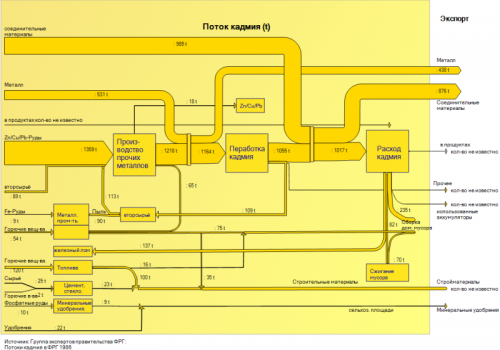
Recently they had a post with a sample Sankey diagram in Russian.

A short interpretation is difficult for me this time, as I don’t understand Russian. I can detect a copper, zinc and lead flow labeled with element names (Cu, Zn, Pb) and iron. One color is used for all flows. The quantities are in tons.

Anyone can explain more of this Sankey diagram?