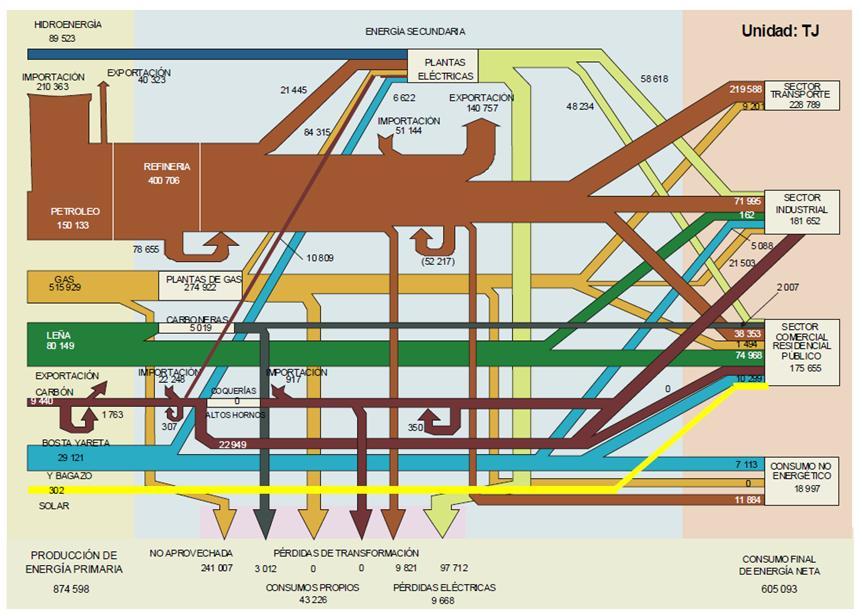
Came across this Sankey diagram showing the energy flows in Peru in an article on Renewable Energies in the Energy Strategy on Alberto Ríos Villacorta’s blog.
It has the typical structure of a national energy flow Sankey diagram as I have shown here on the blog many times. Flows are in terajoule (TJ) and have a general left-to-right orientation. On the left are the different energy carriers (primary energy), conversion in the middle section, consuming sectors on the right. Losses branch out to the bottom.
Unfortunately the streams are not to scale in this Sankey diagram. Compare for example the 80.149 TJ energy from “leña” (wood) in green to the 515.929 TJ of energy embodied in gas (sand color) right above. The gas arrow should be approximately 6 times wider – still it is drawn thinner. Even worse the situation for losses in gas processing where 241.007 TJ are “no aprovechada” while 274.922 TJ pass through gas processing (“planta de gas”). Roughly half of the energy embodied in gas is not used, but it looks as if that arrow branching out to the bottom represents some 10 to 15% of the total flow only. Many other examples of wrong arrow magnitudes can be found.
So, some very general basics of Sankey diagrams are ignored here. Readers should check the flow quantities carefully, and not rely on the perceived quantities represented by the arrows.
