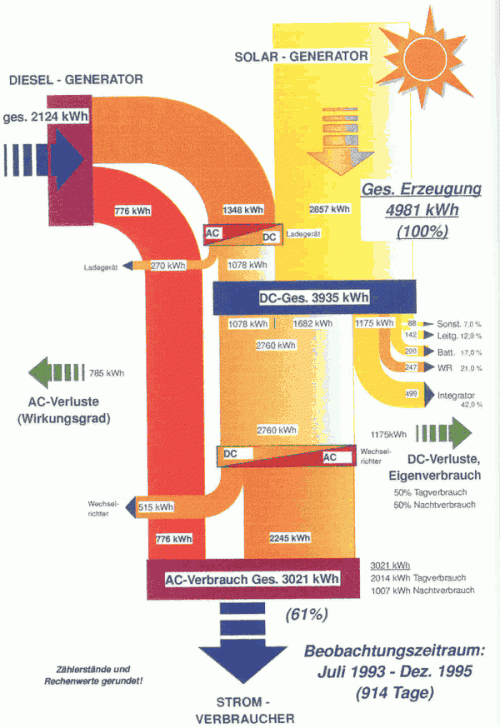
An interesting project summary can be found on the energyech.at pages, “a virtual exhibition and information platform” by the Federal Ministry of Traffic, Innovation and Technology (Department for Energy and Environmental Technologies) and the Austrian Energy Agency”. A PV-diesel hybrid energy generation system was installed at mountain refuge “Klagenfurter Hütte” in southern Austria to secure power supply and reduce dependency on diesel fuel, and to bring down energy costs.

The Sankey diagram shows the energy flows over a 30-month test period from July 1993 to December 1995. Out of the 4981 kWh of energy, 2124 kWh were produced by the diesel engine, while 2857 kWh came from the 18 sqm installed PV modules. A storage battery is installed, and the diesel generator can be used to recharge it if there is no sunshine. The overall efficiency of the system was 61% over the testing period, but could be higher after the energy measuring equipment (consuming 499 kWh itself) was removed after the testing period.
The Sankey diagram shows actually measured values in kWh. It has a top-to-bottom orientation. Diesel is on the left side, the photovoltaic system on the right. Losses branch out horizontally. The battery is the blue box labeled “DC-Ges.” in the middle.

