Tag: remake

EU Steel Flows, from MFA Diagram

Browsing through the blogs on data visualization and infographics (check my blogroll) I often find inspiration in Nels’ MFA diagrams. From time to time I like to beef up the skinny MFA diagram skeletons a bit by converting them into Sankey diagrams. At the same time, by translating the numbers into Sankey arrows one gets a better idea what the main (mass) flows are.

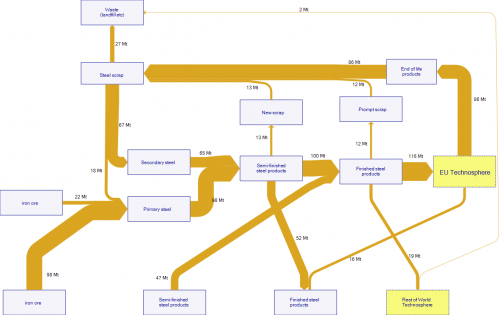
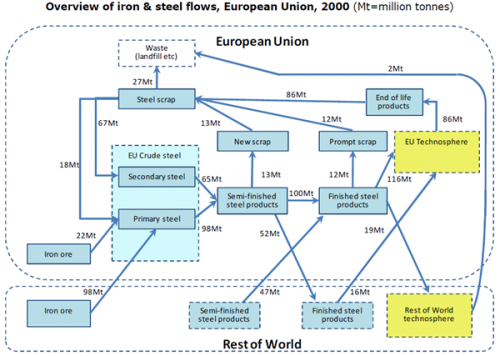
This is a MFA diagram on Iron and Steel Flows in the European Union in 2000 as found in this post. Original data is from a 2008 OECD study, flows in Mt.

The description of the diagram says: “A study of iron and steel flows in 2000 in the European Union showed that an input of about 120 Mt of iron ore (of which 98 Mt was imported) yielded 98 Mt of primary crude steel (i.e. produced directly from iron ore and coke). A further 65 Mt, representing 40% of total crude steel production, were produced as secondary crude steel, produced from scrap steel.”

I did a first quick version of the flows as Sankey diagram, trying to stick very much to the layout of the original diagram. All nodes are the same size and more or less located at the position of the master. It already shows that the main steel flows: iron ore imported into the European Union, and steel scrap being recycled within the EU. Export of semi-finished steel products from the EU to the Rest of World (52 Mt) almost balanced with 47 Mt of semi-finished steel products imported into the EU.

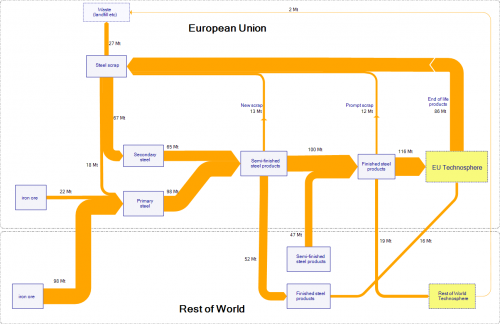
I tried to improve the diagram by removing the three nodes ‘New Scrap’, ‘Prompt Scrap’ and ‘End of Life products’ since there is no transformation of these flows at the nodes (also no change in quantity). Further I reduced the size of some boxes and dragged the ‘Semi-finished Products’ (Rest of World) box closer to the ‘Finished Steel Products’ (European Union) box to avoid crossing streams. Wherever possible I try to avoid diagonal arrows.

The final result also has the Rest of World and European Union grouping. I am not to happy with the colors though.

Your thoughts?
Show it with Sankey Diagrams

Phosporus in the natural environment and the food chain has been a topic of several posts on my blog. So it didn’t come as a surprise to find yet another diagram on phoshphorus flows over at Nels’s MFA Diagram blog (one of the blogs I follow closely, see blogroll).

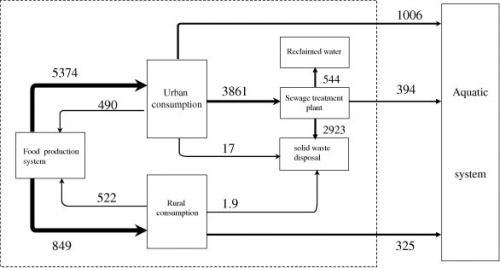
MFA diagrams have their focus on the nodes and the build-up of stocks. Sometimes they get a touch of Sankey diagram with the arrows having different magnitudes. The MFA diagram below is for phosphorous flows in China 2008 (original source: Min Qiao, Yuan-Ming Zheng, Yong-Guan Zhu, 2011. Material flow analysis of phosphorus through food consumption in two megacities in northern China). Values are in tonnes.


(click image to enlarge)

We can detect arrows with three different brush widths (my guess is 1px, 2px and 4 px), each standing for a value range into which the actual flow quantity falls. This may, however, bes somewhat misleading when having a quick glance at the diagram.

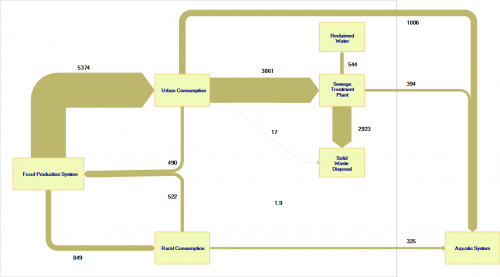
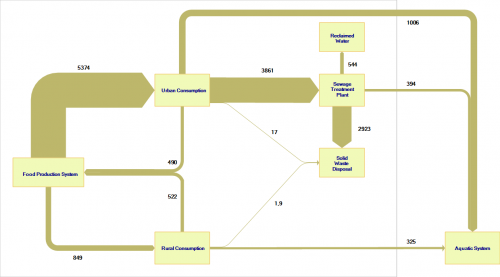
I quickly “translated” the above diagram to a Sankey diagram with flow values being actually to scale.


(click image to enlarge)

Here it is quite clear where the major phosphorus flows are located (from food production via urban consumption to sewage treatment plant and solid waste disposal: 2923 out of 5374 tons end up here). The other flows are comparatively small, with the phoshporous flow going directly to the aquatic system worth a mention. Two small flows in the center of the diagram are negligible, they are in fact so tiny in comparison to the major flows that they even don’t show up (or just as a hairline) here.

I have therefore added a minimum width of 1 px for small flows so that the annual 17 tons from urban consumption and the 1.9 tons from rural consumption to the solid waste disposal are at least visible (albeit not to scale with the other flows any more).


(click image to enlarge)

Final phosphorous sinks are solid waste disposal (landfill?) and the aquatic system.

Pimp my nitrogen Sankey

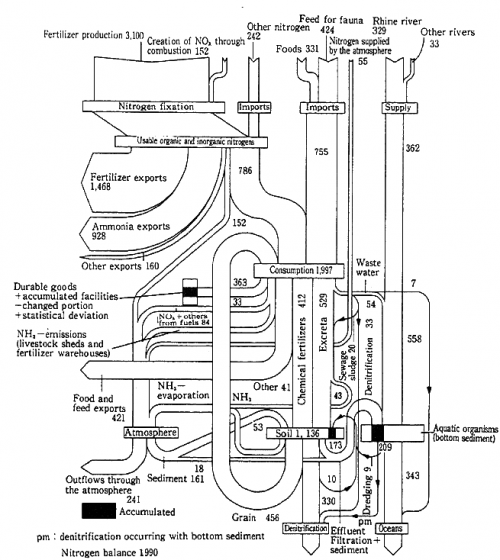
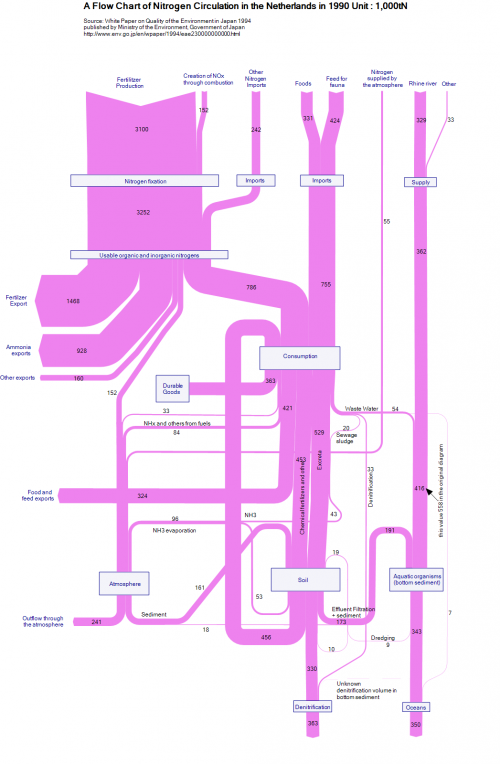
Below is an example of a Sankey diagram showing a nitrogen metabolism. The original diagram is from a Japanese publication (‘White Paper on Quality of the Environment in Japan 1994’), even though the diagram represents nitrogen loads (in 1000 tons N) in the Netherlands in 1990.

A pimped version of this diagram can be found in the e!Sankey download gallery. I don’t like the color very much, but the overall aspect of the diagram is much better than in the b/w version, I think.


They seemed to have struggled with inconsistencies in the original diagram, as an annotation suggests. Also the denitrification due to accumulation in the bottom sediment, or nitrogen ending up in durable goods (shown in black in the original) are not represented in the remake. For the rest it pretty much sticks to the original.

Thinking about a new tag “pimp my Sankey”…