Tag: software

New version of e!Sankey

A new version of e!Sankey has been released recently. e!Sankey 3.0 comes with a series of new features, such as reconnecting arrows to another node, alignment of elements, definition of unit types, or the long awaited multiple element edit. According to their forum they have also implemented a number of features suggested by the e!Sankey user community.

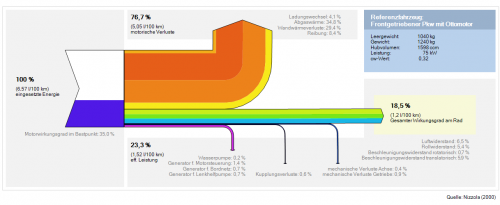
The below are two new samples shipped with the test version. The first is for the efficiency of a car engine, in German…


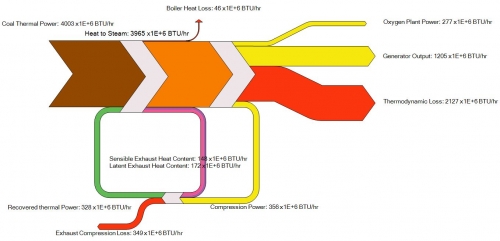
… the second a remake of the oxy-combustion Sankey diagram I presented here on the blog two years ago:

The price has gone up a little for the new version. I have updated my Sankey software page accordingly.

Embodied Carbon Sankey Diagram

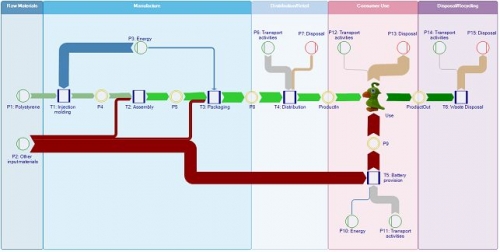
I found the idea behind the below Sankey diagrams quite compelling. Both are from the user manual of the ‘Umberto for Carbon Footprint’ software by ifu Hamburg. They are also the makers of e!Sankey, and it seems as if most of the e!Sankey software features are also included in this new software for modeling and calculating product carbon footprints.

I played with the demo models included in the trial version, one of which is for a toy parrot. The product life cycle is modeled from cradle-to-grave with the raw materials, assembly, distribution, use, and end-of-life phases. Using embodied carbon data from an LCI database for the raw materials and energy used along the life-cycle, a carbon footprint is calculated. The material and energy flows related to the product manufacturing and use are then shown as a Sankey diagram.

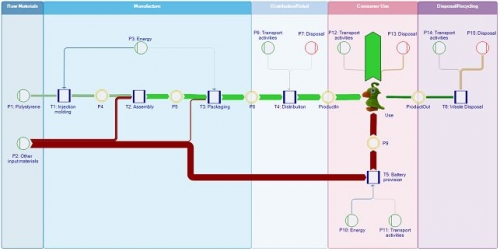
The Sankey view can be switched to an ’embodied carbon’ or carbon load view, which shows the ‘carbon rucksack’ of the product as it cumulates along the supply chain.

In this second Sankey diagram the arrows representing the greenhouse gas burdens caused by the waste disposal phase are turned around, so that both the upstream supply chain as well as the downstream processing after the product use are visually added. They form one large Sankey arrow (shown in green here) for the product’s carbon footprint.

This is of course not a Sankey diagram drawing software, but rather a modeling or calcalation tool for carbon footprints. Still, I think, this is a fine use case where Sankey diagrams unfold their full visualization power. It can be immediately grasped which stage of the life cycle, or which raw material or energy supply contributes most to the carbon footprint.

Note: Have added this to the software list.
Sankey Diagram Function in R

I am always getting excited when I have a new e-mail with a Google alert for Sankey diagrams. This time I was directed to this blog post.

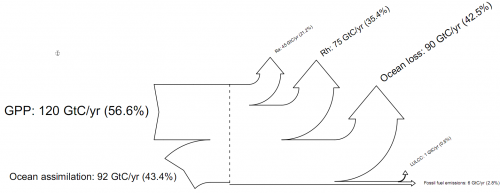
SankeyR is a function for the R open source statistical computing and graphics package based on the drawSankey routine for Matlab developed at EPFL. Aaron Berdanier at Colorado State adapted it to work with R. It produces simple left-to-right Sankey diagrams like this one:

The routine creates a plot in R, or can be outputed to bmp or pdf format. “Inputs do not need to equal losses. Any difference will be displayed as a discrepancy in the height of the left and right sides of the diagram. This capability enables the developer to examine imbalances in flows.”

Get the source from Aaron’s blog.

I have added SankeyR to the Sankey software list. Thanks Aaron for sharing this with the R community. I am just not sure how what to make of the blog name…

SankeyTurtle

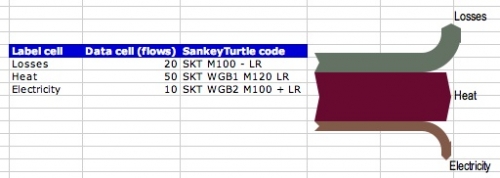
Gabor Doka, developer of SankeyHelper is currently working on SankeyTurtle, the implementation of a simple language for arrow routing in his Excel macro-based diagramming tool SankeyHelper. SankeyTurtle is currently being beta-tested.

The idea of SankeyTurtle code is to give each Sankey flux – each data cell – an accompagnying instruction how to draw the flux exactly in terms of path and geometry. The SankeyTurtle syntax is based on the vintage Logo TurtleGraphics drawing language, where you tell an imaginary turtle with a pen attached to it’s tail commands like “Move Forward” and “Turn Right 90°” and record the trail of the pen.

This will definitely an exciting improvement for all users of the SankeyHelper freeware … sorry, Sankeyware.

I’ll keep you posted about the progress and any official release.

Matlab routine for simple Sankey diagrams

Just came across a new piece of software for simple Sankey diagrams.
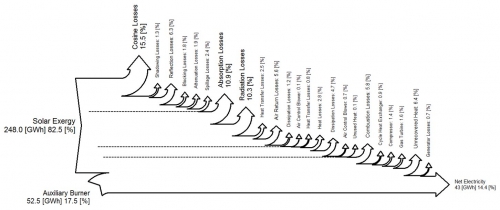
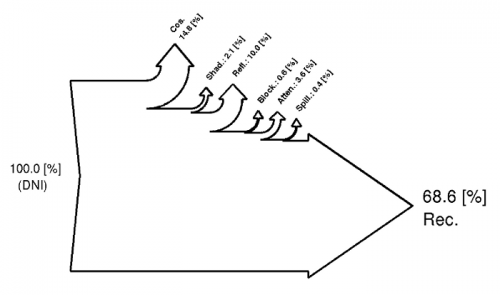
DrawSankey.m is a routine for Matlab that allows to produce diagrams like these:

DrawSankey.m is from the Industrial Energy Systems Laboratory (LENI) at Swiss EPFL in Lausanne. Find more information on their Wiki.

I haven’t tested it myself yet, but this definitely looks like an interesting add-on for Matlab users. I have added drawSankey.m to the Sankey software list.