Tag: Spain

Spain: Energy, CO2, Cost

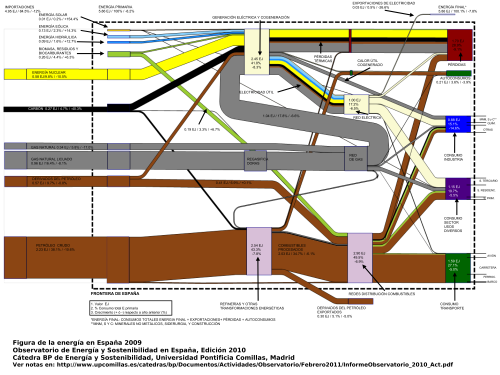
I am aware that I was kind of ‘Sankey diagram bashing’ with my post on Spain energy flow diagram last December. Now here is another one from the Iberian penninsula that fully makes up for the first one. It is by Observatorio sobre Energía y Desarrollo Sostenible (Observatory of Energy and Sustainability in Spain) at the Universidad Pontifícia Comillas in Madrid. I find it noteworthy that the observatory is part of a BP financed chair at the Escuela Técnica Superior de Ingeniería (ICAI).

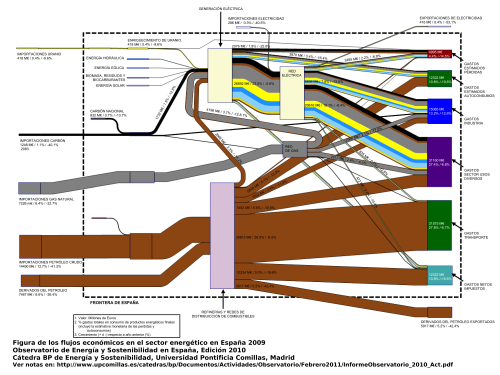
The annual report 2010 includes three Sankey diagrams, two of which are shown below. The first Sankey diagram (p. 16 of the report) has the typical pattern of a ‘national energy consumption, conversion and use’ diagram, similar to the ones presented here on the blog several times already for other countries.

The flows from the left show energy sources, the nodes on the right are the use sectors. A nice feature here is that the node heights are adapted to the magnitude of the Sankey arrow, so that the largest energy consumption can immediately be seen. Flows are in in Exajoule (1 EJ = 1000 Petajoule = 10E18 J). The total primary energy consumption in Spain in 2009 was 5.86 EJ (4.95 EJ of which are from imported fuels). Also shown next to the absolute quantities is the relative share of each flow in percent, and the change in comparison to the previous year.

The second Sankey diagram (p.22) is what I would call a value stream Sankey diagram.

This is interesting as the market price for the fuels, as well as for converted energy is used as a weighting factor, so that each Sankey arrow shows the value of the energy flow in millions of Euro. At some nodes you can see that a smaller arrow enters, and a wider arrow leaves: These are the conversion processes where value is added (or energy gets more expensive). This is a compelling concept for a Sankey diagram (another similar example is here), one that somehow could make Sankey diagrams more interesting for economists or controllers, rather than considering them exclusively in the engineering domain.

The third diagram (not shown here, p. 19 in the report) shows the embodied carbon or the greenhouse gas emissions related to the different fuels, broken down by fuel and sector of energy consumption. The embodied carbon in the energy carriers were roughly 285 Mtons in 2009. The Sankey arrows for renewable energy sources as well as for Uranium are not present in the third diagram.

Me gustan mucho estas tres diagramas de Sankey! Merecen elogío.
Energy Flows Spain 2009

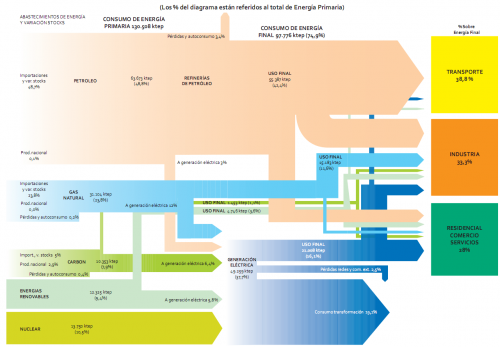
Another example of a national energy flow Sankey diagram, this time from Spain for 2009. To be found on page 40 of the recently published ‘La Energía en España 2009’ (large 10 MB PDF!) downloadable from the Ministry of Industry, Tourism and Commerce (MITYC) website. This is somewhat more advanced than the one from Spain I showed in this post.

Flows are in ‘ktep’ (ktoe, ‘kilo tonnes of oil equivalent, in Spanish), and percentages given are in relation to the total primary energy (130.508 ktep primary energy in 2009).

Nice and colorful, indeed. But again a good example of how to make mistakes (i.e. violate the basic rules) in drawing Sankey diagrams. So, here is the Sankey didactics part….

a) Arrows should be (no: must be!) to scale. Example: See blue arrow ‘USO FINAL’ with 16.1 % in comparison to blue arrow ‘consumo transformación’ with 19.1%
b) The same arrow should not change its width …
… while it runs in the same direction. Example: light green arrow ‘USO FINAL’ gets narrower as it runs vertically before branching to the sectors ‘Transporte’ and ‘Indústria’. Very weird!
… when it changes the direction. Example: pink arrow from the petroleum arrow going to the sector ‘Residencial’ is much wider on the vertical segment than on the horizontal segment.
c) An arrow should not maintain its magnitude …
… as it splits into two different flows. Example: green arrow ‘USO FINAL’ splits into two flows of the same width leading to the sectors ‘Residencial’ and ‘Industria’.
… as other flows branch off. Example: blue arrow ‘USO FINAL’ continues with the same magnitude to the sector ‘Residencial’, even though a considerable portion branches off to ‘Industria’.
d) It would be nice to have labels on all flows. Many negative examples, especially on the right hand side of the Sankey diagram.

Anyone care to do a better version?

Madrid spendings in culture 2009

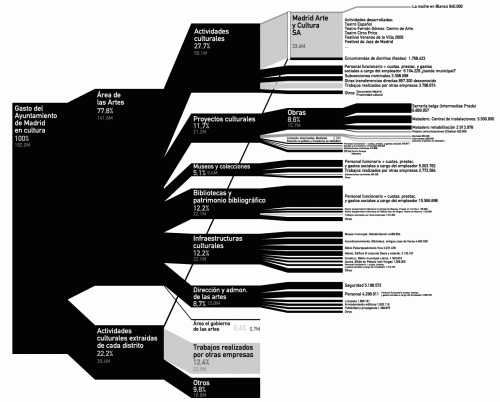
kulturometer.org presented a fantastic diagram that shows the municipality of Madrid’s spendings in cultural activities in 2009. By compiling data from numerous tables, tender calls, and administrative bulletins, they managed to stunningly visualize what one commenter called an ‘information overload’ (‘apagón informativo’). Click on the diagram to enlarge.

This is a breakdown diagram, or ‘diagrama de brazos’, that shows the distribution of the overall cultural budget (182 Mio Euros in 2009) by sectors, sub-sectors, and even into individual types of activities or projects.

It somewhat reminds me of Nicholas Rapp’s AIG bailout diagram, even though less colorful…

Each branch of the diagram is labeled with the relative weight in percent, as well as the absolute value in millions of Euros. The color scale indicates the reliability of the data, either non detailed estimate (light grey), published estimate (grey), or published budgeted data (black).

Here is the full diagram in large scale (PDF) with an additional breakdown of one particular section (Medialab) at another scale and full legend and annotations
Watch a slide show to learn more about the diagram (starting p 19)
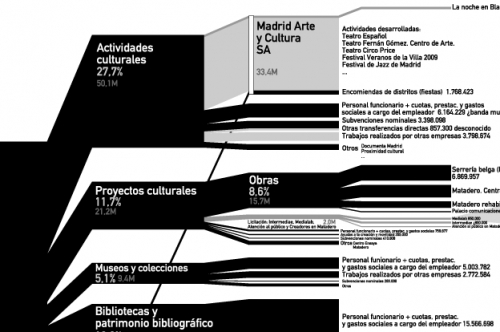
– And finally, a blowup detail of a diagram section:

Sankey for Energy Flows in Spain

One type of Sankey diagram layout seems to get popular recently. A representation of national energy flows of a country with the energy carriers on the left side (source), and the consumption sectors on the right side (sink). The Sankey flows in between show how energy from these sources are consumed and in which sector. Wasted energy is shown, and the overall energy (in)efficient use of primary energy is made clear with such a Sankey diagram.

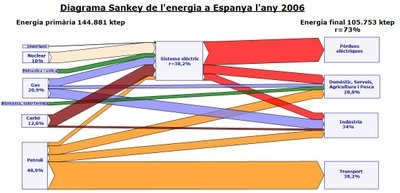
I just discovered the energy flow diagram for Spain for 2006 on Joan Vila’s blog.

Unfortunately I don’t speak Catalán (well, I learned that “blog” is “bloc” in Catalán!), and the image quality isn’t very good. You can see nuclear, natural gas, coal (“carbó”) and crude oil (“petroll”), as well as hydro an wind (the two green lines) on the left side. The top box on the right side that takes the big red Sankey arrow for losses from electricity generation (“pérdues”). The others are the use sectors transport, industry, and domestic / services / agriculture. Vila calculates an efficiency of 38,2% for the electric power generation.

Joan advocates Sankey diagrams for visualizing and being able to better understand the issue. He says, that you won’t understand many things about what’s going on, if you don’t study this [kind of] diagram (“No entendrem moltes coses sobre el que passa si no estudiem aquest diagrama.”).

Check out simiular diagrams for Japan, Scotland, Ireland, Canada, United States.