Tag: U.S.

Water Use in Coal Power Plant

This presentation on ‘Water Management for Fossil Energy Systems’ by Susan M. Maley, Technology Manager for Crosscutting Research at the U.S. Department of Energy (DOE) / National Energy Technology Laboratory (NETL) gives an overview of the activities and research into ‘Current Activities in Water Management Research and Development’.

On page 9 it features these two Sankey digrams showing water usage in a 500 MW pulverized coal plant.

On the left the situation without CO2 capture, on the right with CO2 capture. Water withdrawal almost doubles (524 gal/MWh to 1049 gal/MWh) when implementing CO2 capture.

Mind that the left and the right Sankey diagram can not be compared directly as they use a different scaling factor.

River Flow Volume and Temperature

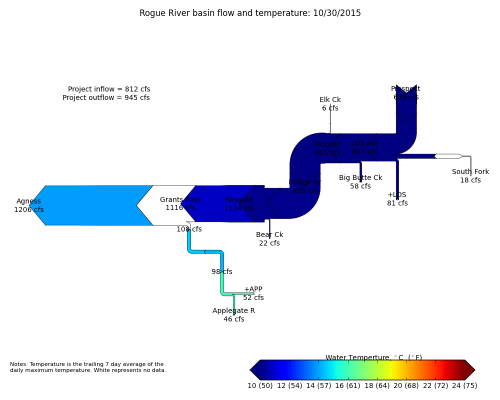
A nice idea for the use of Sankey diagrams can be found on this web page of the U.S. Army Corps of Engineers (USACE) in the Portland OR area.

The diagram shows the flow of the Rogue river and its tributary streams. The fact that the river flows east to west makes this one of the rare examples of a right-to-left orientated Sankey diagrams.

The water volume is represented by the width of the arrow in each segment. Flows are in cubic feet per second (cfs)? At some points along the river the volume seems to increase much more than the feed contributes (e.g. at Bear Creek influx).

As an additional layer of information the color of the Sankey arrows indicates the trailing 7-day average temperature. Temperature color codes shown below.

DOE Energy Water Nexus

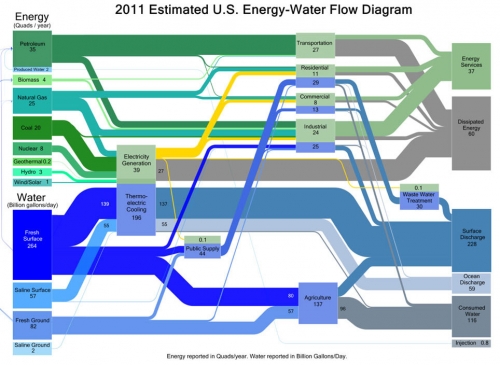
Via the EDF blog (no, not Electricité de France, but Environmental Defence Fund) comes this mixed Sankey diagram for energy and water flows in the U.S. in 2011.

Kate Zerrener explains in the post that energy generation and water consumption are deeply interwoven. The diagram shows which energy production and which consuming sector requires how much water.

“Water is measured in billions of gallons per day (BGD) and energy is measured in quadrillion British Thermal Units (Quads) per year. In the graphic above, water flows are represented in blue, energy in green.”

Careers in Science, Diagram Remake

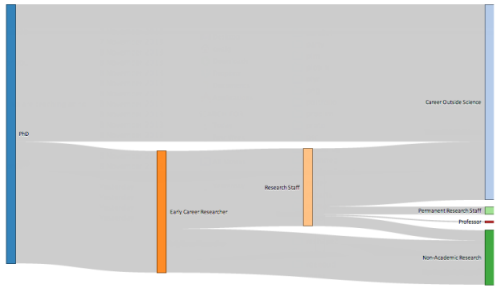
Merian who runs the Boreal Perspectives blog posts on a Sankey diagram that visualizes academic career paths.

This was originally shown in a 2010 Royal Society policy report entitled “The Scientific Century: securing our future prosperity”. Merian raises concerns about the quality of the diagram. She goes: “So what’s so bad about the chart? Some obvious issues:

  • It is unclear what goes in on the left and to a lesser degree what is covered by the end points. The report indicates in a footnote that the term “science” is used “as shorthand for disciplines in the natural sciences, technology, engineering and mathematics,” but the three documents used for input categorise the fields in different ways, and there is no indication which fields exactly would have been selected.
  • Line thickness is not proportional to percentage weight. The 26.5% and 30% streams have the same thickness, and the 17% stream is much less than half the thickness of either. The 3.5% stream is more than half the thickness of the 17% stream.
  • Why does “Permanent Research Staff” not end in an arrow? And why does the arrow from “Permanent Research Staff” to “Careers Outside Science” bend backwards (to suggest it is a step back in one’s career, that is, an implicit value judgement?) and then not even merge with the output stream?
  • Does it really mean to suggest that no one goes from “Early Career Research” (that is, a post-doc) to “Career Outside Science” (or to industry research)? In my experience, watching post-docs, that is quite a common choice for post-docs precisely because non-academic jobs may be offering better pay and conditions, or because they don’t have a choice at that stage.”

She then presents a remake of the above diagram made using the Sankey plugin for d3.js

Indeed, the distribution diagram without the arrow heads seems to be better suited. The overall appearance is much more calm.

Merian, however, concludes “no graph would have been more useful”.

Biomass 2-in-1 flipped Sankey Diagram

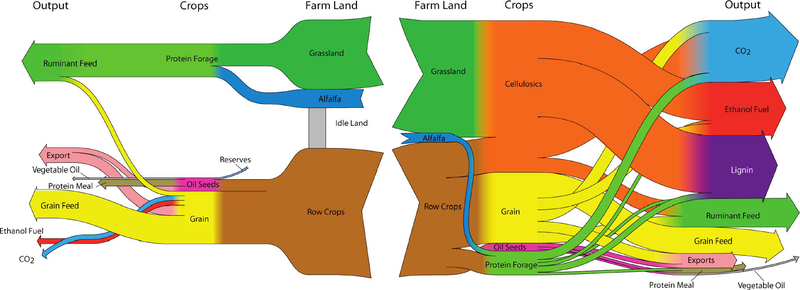
Browsing my previously bookmarked Sankey diagram samples I came across this one which I find interesting. The diagram was shown in a Green Cars Congress blog entry in 2010 and illustrates a study that finds that “large scale biofuel production can be successfully reconciled with food production through the use of land-efficient animal feed technologies and double-cropping”. The authors of the study are Dr. Bruce Dale and colleagues at Michigan State University.

As always I refrain from commenting the underlying content as I am not a domain expert. Rather I would like to focus on what makes this Sankey diagram special.

These are actually two diagrams that are “flipped” over at a vertical center line. The left half of the diagram has a right-to-left orientation and shows the “114 million ha of cropland used now to produce animal feed, corn ethanol, and exports”. Some cropland sits idle and is not used productively. The right half is a second Sankey diagram and shows a different use of the cropland with “major crops and outputs for the maximum ethanol production scenario”. No units in the Sankey diagram but the central columns seems to represent the land area (million ha), while the two outer vertical columns (Crops, Output) show mass (tonnes?) on a different scale.

In contrast to the first scenario it can be observed that “30% of total US cropland, pasture and range, up to 400 billion liters (106 billion gallons US) of ethanol can be produced annually”. Ethanol can be used as an alternative non-fossil car fuel. CO2 emissions are also higher but this is from biogenic sources.
New Energy City Issaquah

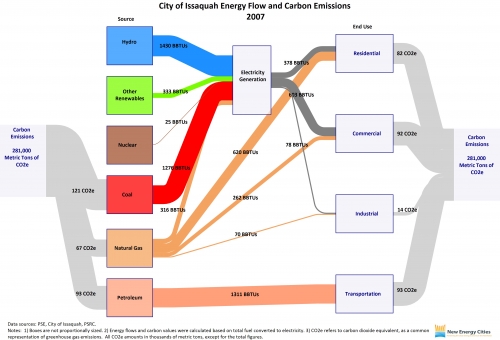
Have you ever heard of the city of Issaquah, WA? To be honest, I hadn’t heard of it until I read this post on the New Energy Cities blog.

Issaquah is one of ‘New Energy Cities’ in the Northwest that has created an Energy Map and calculates the carbon emissions it is responsible for based on the fuels used. The role model for these Sankey diagrams are the ones published by the EIA.

Elizabeth, the author of the post, writes:

“Total carbon emissions are depicted in the gray flow lines, by both source and end use. The blue flow line represents hydropower energy used for electricity generation; the green represents non-hydropower renewable energy used for electricity generation; the brown represents nuclear energy used for electricity generation; and the red represents coal energy used for electricity generation. The orange flow lines represent natural gas used for electricity generation and direct heating. The pink flow line represents petroleum used for transportation. The dark gray flow lines represent electricity consumption by residential, commercial, and industrial user categories.”

Wow! I’ve seen those energy Sankey diagrams for the world, for nations and for federal states. But this one for Issaquah is definitely the one that covers the smallest geographical and administrative entity.