Tag: water

Alberta Report full of Sankey Diagrams

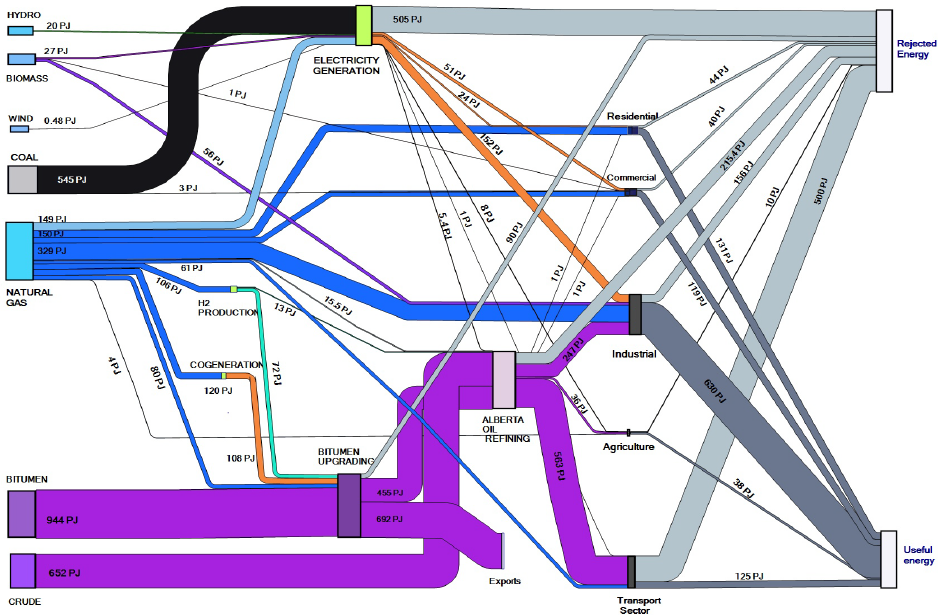
A recent report prepared by Kumar, Subramanyam and Kabir of the Department of Mechanical Engineering at the University of Alberta in Edmonton describes “Development of Energy, Emission and Water Flow Sankey Diagrams for the Province of Alberta Through Modeling”. Canada has been underrepresented with Sankey diargams on this blog, I feel. But the numerous Sankey diagrams on water and energy really compensates for this lag: I counted 12 more or less beautiful Sankey diagrams. Here is an example:

This is for the energy consumption in Alberta. Flows are in PJ (not sure which year they refer to). There are also several Sankey diagrams in this report for the water catchment areas of rivers (pp. 27-34).

Download the full report here (caution 6.5 MB PDF)

Colorado River Water Accounting Sankey

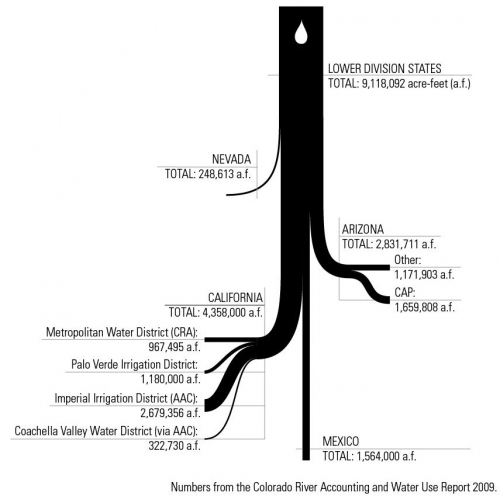
From Fei-Ling Tseng’s design blog comes this Sankey diagram. Her post is on some visualizations and infographics done for a project on water economies/ecologies of the Colorado River water system.

The diagram shows the distribution of water from the Colorado river to different lower basin states (Nevada, Arizona, California), “export” to Mexico and a breakdown to irrigation areas within California. The quantities are in acre feet (a.f.). Underlying data is from the Colorado River Accounting and Water Use Report 2009.

Simple, beautiful, conveying the message … and a single white water-drop as catchy design element.

Water Flows – before and after

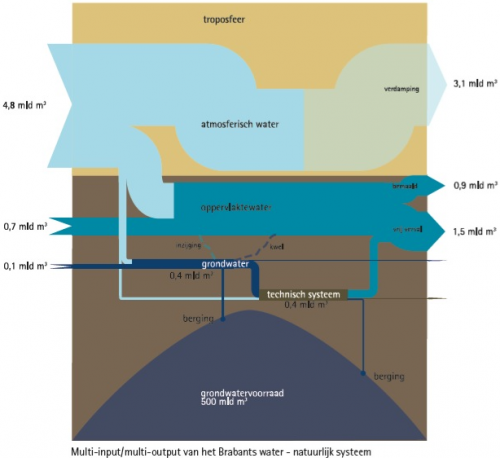
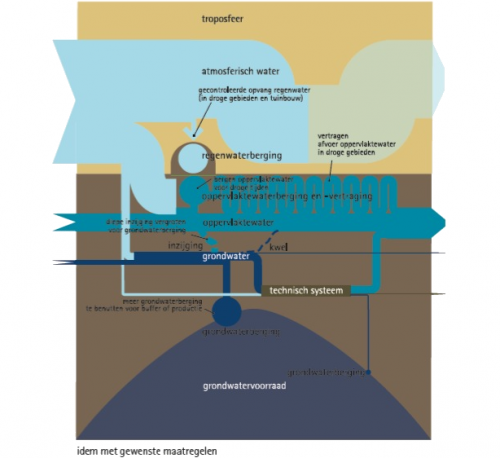
A reader of the blog, submitted the below Sankey diagrams on waterflows in the province of North Brabant in the Netherlands.

Wies writes about these:

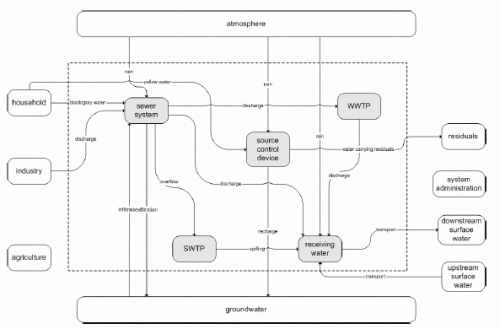
The left chart is the actual Multi Input – Multi Output analysis. There are some irregularities and inefficiencies. Therefore we made the chart on the right showing some design proposals. These are not really related to exact quantitative in or output, it’s a bit more freeminded, so no numbers are included here.
We also tried to combine the actual flows of water with the bodies of water (troposphere in the air, the bulk of ground water in the ground)

The report that contains the two diagrams can be found here. Check out p. 22 of the PDF.

Thanks for sharing this!

Water Flows in Electro Plating

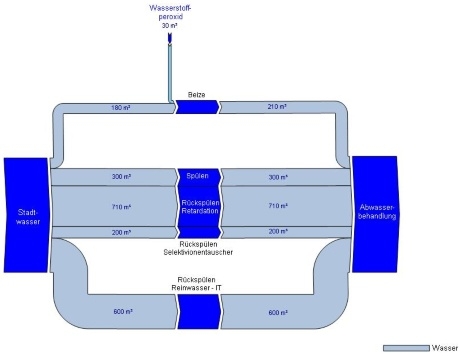
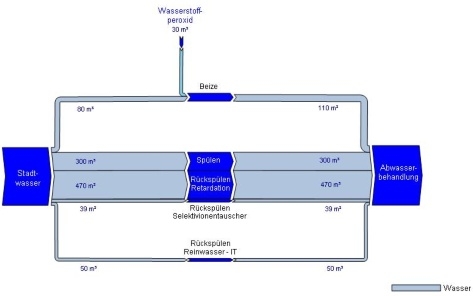
Austrian consulting company Stenum has revamped their Sankey Editor 2008 website a little bit, and they added new sample Sankey diagrams. The ones shown below are for the water flows of an electro-plating factory before and after optimization.

before:

after:

The diagram is in German, but I can understand as much as this: All flows are in cubic metres. Apart from the hydrogen peroxide flow entering from the top the flows shown all run from the source (water supply) to the sink (waste water treatment), the nodes in the middle (flushing, backflushing?) are the actual breakdown of the water flows. These nodes are adapted to the arrow width – a nice feature.

On top of that, blue seems the right choice for both water and H2O2 flows.

What goes up, must come down!

For most Sankey diagrams I find when browsing the web, a ‘left-to-right’ or ‘bottom-to-top’ orientation prevails. ‘Top-to-bottom’ is less common, but there are also examples like this one.

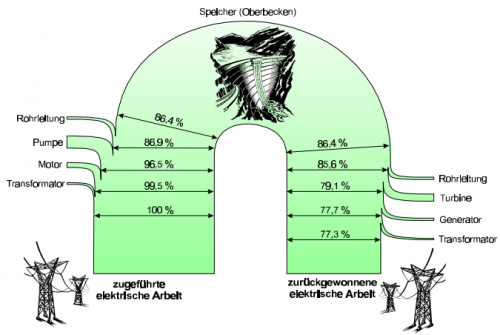
A rather untypical shape for a Sankey diagram has been up on the German page of the e!Sankey webpage.

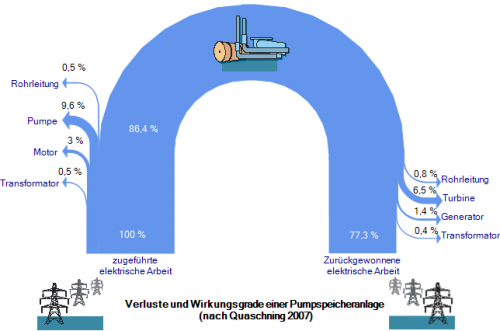
It shows the energy balance for a pumped storage power plant as a curved shape, with the energy input at the left leg, and the energy that can be recovered (77.3%) at the right one.

Energy is stored “in the form of water, pumped from a lower elevation reservoir to a higher elevation. Low-cost off-peak electric power is used to run the pumps. During periods of high electrical demand, the stored water is released through turbines. Although the losses of the pumping process makes the plant a net consumer of energy overall, the system increases revenue by selling more electricity during periods of peak demand, when electricity prices are highest. Pumped storage is the largest-capacity form of grid energy storage now available.” (Wikipedia)

I searched for the original Sankey diagram in the source given (Quaschning 2007) and found this text with the diagram in chapter 6.1.2. That diagram already featured the curvy shape, and has just been reproduced similarly.

The use of the curve layout seems justified here. The author chose it to point out the difference in altitude. The upper basin is at the apex of the curve. Water pumped up from the lower basin requires energy, which can partly be recovered when the water runs down again.

What goes up…

Water Balance (or: Metabolic Profile Sankey)

This article on “Conceptualizing the built environment as a social-ecological system” by Sebastian Moffatt (CONSENSUS Institute) and Niklaus Kohler (University of Karlsruhe) published in Building Research & Information, Volume 36, Issue 3 May 2008 , pages 248-268 has an exciting Sankey diagram in the section ‘Current perspectives, promising methods, missing pieces’ (scroll down about half way).

The authors explain Sankey diagrams as an instrument of Material Flow Analysis (MFA)

“Sankey (directional flow) diagrams are often used to summarize the MFA visually as an entire connected and balanced system. In a Sankey diagram the material flows begin with inputs from nature, then flow into intermediary processes (any infrastructure used for processing, converting, storing, or regulating), and then into the various end use(s). After use, flows may be reconverted by infrastructure systems for reuse or recycling. Ultimately, all flows are directed to a category of output (waste products emitted into air, into water bodies or into landfills; long-term storage; export). The balanced accounting thus tracks every flow from source to sink.”
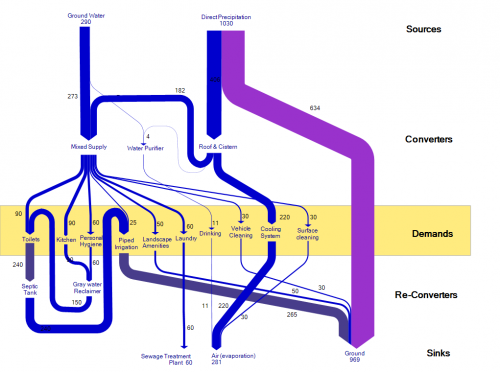
The original Sankey diagram shown in this article is for an resource efficient house, planned or built in New Delhi (India). It sports the water flows through five groups of processes (sources, converters, demands, re-converters, and sinks). The authors call it a “five-partition metabolic profile”, and suggest that it can be done not only for a single house, but “for the built environment at any scale, from parcel to urban region”.

The unit for the quantities given is not indicated, but I presume the water flows are in litres.

When reproducing the Sankey diagram (see above) I tried to make it a little more clearer by changing the order of the (invisible) nodes, thus avoiding crossing flows.
Odum’s Energy and Matter Flows in Ecosystems

A visitor to this blog pointed me to the work and life of system ecologist Howard T. Odum.

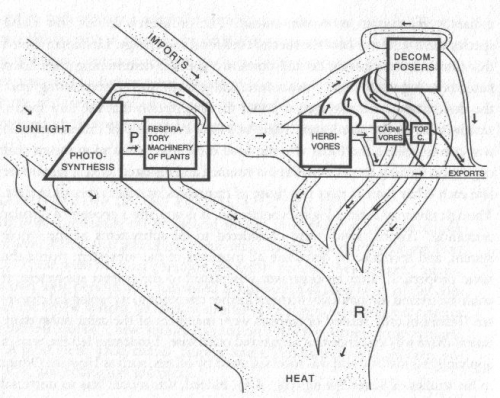
Odum “in his early work used a diagramming methodology very similar to the Sankey diagrams used in chemical process engineering. In this model energy and matter flows through an ecosystem”.

In Odum’s ‘Silver Spring Study’, he

…mapped in detail all the flow routes to and from the stream. He measured the energy input of sun and rain, and of all organic matter – even those of the bread the tourists threw to ducks and fish – and then measured that gradually left the spring. In this way he was able to establish the stream’s energy budget. (Wikipedia)

This diagram shows the energy flows in the ecosystem. The main contributors are sunlight and other biomass imports. Energy “leaves” the system as exports (extraction of animals and biomass) and mainly as decomposed matter. There are no absolute figures in this diagram, but the proportions seem to be represented by the arrow magnitudes.

The diagram has a nice “natural touch” to it, and at first sight one might think that you are looking at the arms of a river delta…

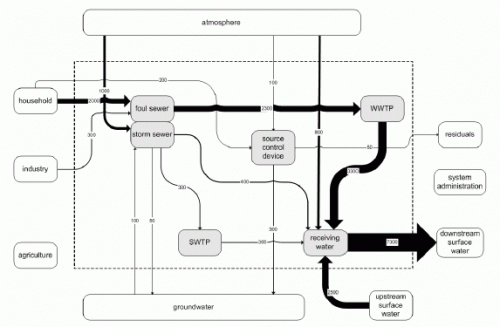
Substances in Wastewater Treatment

In the Wiki of the CD4WC (Cost Effective Development of Urban Wastewater Systems for Water Directive Compliance) project, I found an interesting Sankey diagram that I wanted to share with you.

This project, funded by the European Commission, deals “with optimising the efficiency of urban wastewater systems with regard to ecological consequences in natural water bodies and with regard to investment and operation costs.”

The waste water treatment process system is shown with a schematic flow diagram. For individual substances that can be found in the waste water, the diagram is then displayed with Sankey flows, that represent the quantity. Thus, Sankey diagrams are a possibility for the “determination of fluxes of substances per unit of time”. This presentation is part of a method is coined Substance Flow Analysis.

This presentation is very advantageous: The nodes in the system (the process blocks) remain at the same position, only the magnitude of the arrows changes, when switching to the substance flows view. Flows with large quantities substances are clearly visible.

It would also be a possibility to introduce as a third view (next to absolute water quantity, and substance quantities) the substance concentrations (impurities per m³ of waste water).