Tag: WEEE

WEEE in Midi-Pyrénées

From what I know, France’s approach to tackling energy and waste issues is to break the topic down to the regional level, and to involve local stakeholders.

Here is an article on ‘Métabolisme territorial et filières de récupération-recyclage: le cas des déchets d’équipements électriques et électroniques (DEEE) en Midi-Pyrénées’ by Jean-Baptiste Bahers that was published in the journal Développement Durable et Territoires. Vol. 5, n°1 in February 2014.

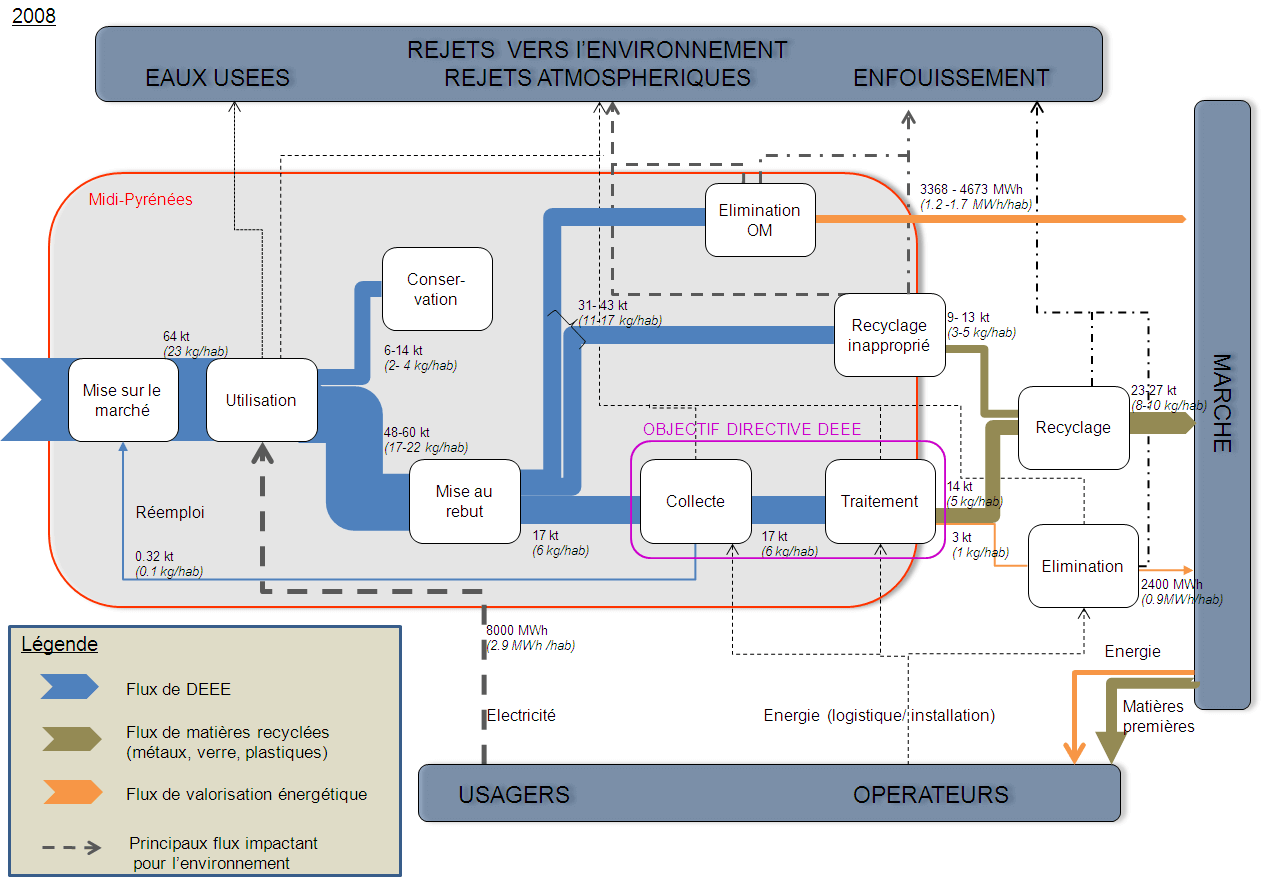
It discusses the ‘Territorial metabolism and recovery-recycling chain: the example of Waste Electrical and Electronic Equipment (WEEE) in the “Midi-Pyrénées” region and has the following Sankey diagram figure.


Licensed under CC BY-NC 4.0

WEEE waste streams are in kilo tonnes (kt) in the year 2008. Additionally, recovered energy from waste treatment is shown (in MWh) with orange arrows. The red line delimits the region, so apparently the electronics waste recycling and disposal (élimination) takes place outside the Midi-Pyrénées region. Some flows are labeled with a range (e.g. 6-14 kt), which is obviously difficult to draw as Sankey arrow. My guess is that the median value was used to determine the actual width of the affected arrows. A nice feature are the per capita values (e.g. 2-4 kg/hab), which makes it much easier to grasp and to relate to for the indivdual person living in Midi-Pyrénées.
Precious Metals and Critical Raw Materials

The EU funded PROSUM research project looks at ‘Prospecting Secondary raw materials in the Urban mine and Mining wastes’. The more than 15 institutions participating in the project have recently published their findings in a final report.

The report has some interesting Sankey diagrams on market input, stocks, waste generation and waste flows for product groups such as vehicles, batteries, precious materials and selected critical raw materials (CRMs) contained in batteries, electrical and electronic equipment (EEE) and vehicles.

Here is the diagram for vehicles in the EU28+2 (=EU28 plus Switzerland and Norway) market. Data relates to the year 2015.

Flows are in tons and ktons, blending two scales in one diagram. This merits its own post, I think. (read it here)

The electric vehicles currently driving on the roads are shown as “Stock”, meaning that the materials are in use and that they could eventually be recovered at the end of the life of the vehicle. This is the large stackd bar between “POM” (placed on market) and “De-reg Vehicles”. Again this stacked bar uses two different scales (tons and ktons).

Official report citation: Jaco Huisman, Pascal Leroy, François Tertre, Maria Ljunggren Söderman, Perrine Chancerel, Daniel Cassard, Amund N. Løvik, Patrick Wäger, Duncan Kushnir, Vera Susanne Rotter, Paul Mählitz, Lucía Herreras, Johanna Emmerich, Anders Hallberg, Hina Habib, Michelle Wagner, Sarah Downes. Prospecting Secondary Raw Materials in the Urban Mine and mining wastes (ProSUM) – Final Report, ISBN: 978-92-808-9060-0 (print), 978-92-808-9061-7 (electronic), December 21, 2017, Brussels, Belgium

Study on Computer Waste in Chile

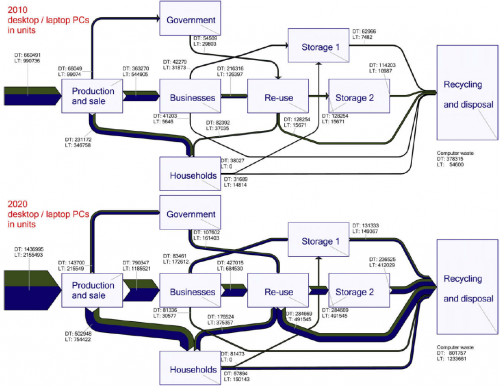
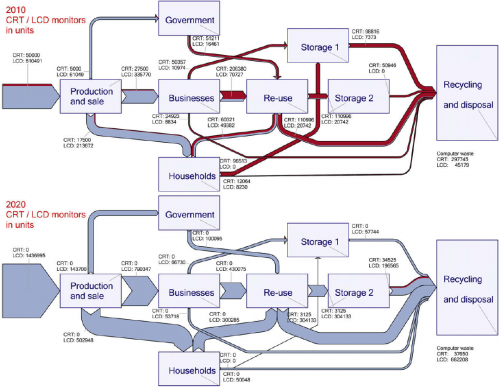
This post on the MFA diagram blog directed me towards a study on computer waste in Chile. The Sankey diagrams featured are for CRT/LCD displays and laptop/desktop computers,

These are the flows of CRT (red) and LCD (blue) in 2010 and expected units in 2020

and the desktop (green) and laptop computers (dark blue) flows in 2010 and expected for 2020 (no. of units).

The full scientific paper can be found here.
(via MFA Diagram blog)