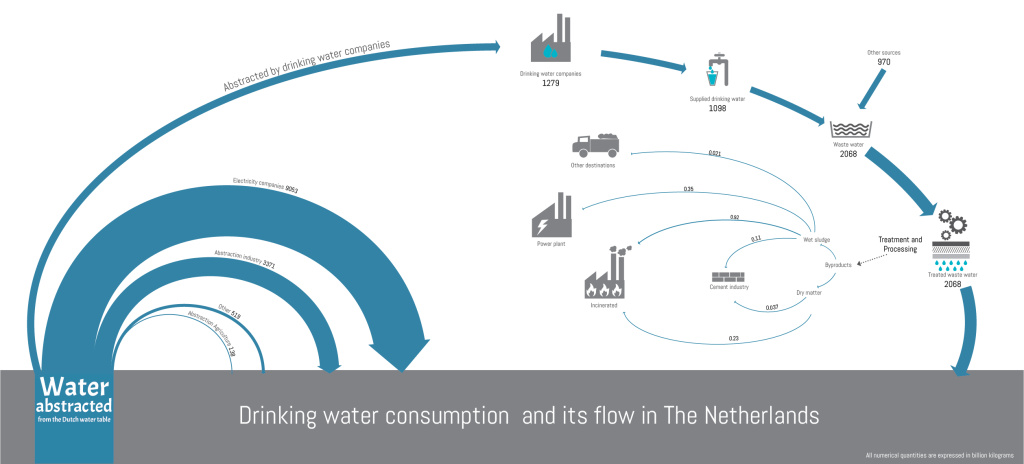
Just a quick post before the weekend: Visualization of the water cycle in the Netherlands by Gunjan Singh. See initial sketch and some comments here.
Quantities are in billion kg (=million tons). “The weight of the arrows depict the proportions most of the time”, exceptions are in the thin arrows at the right which would otherwise be fine hair lines only and almost invisible.
