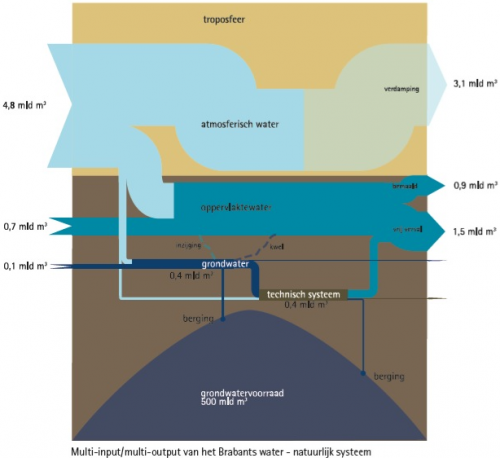
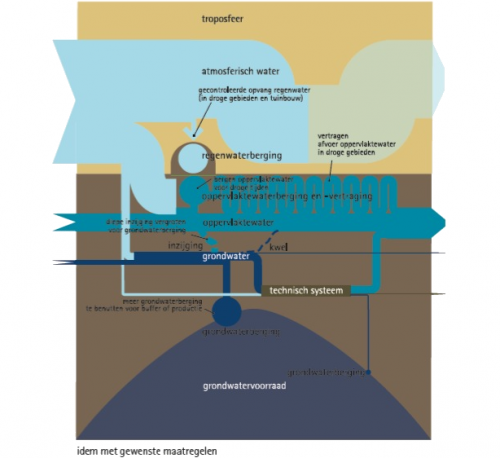
A reader of the blog, submitted the below Sankey diagrams on waterflows in the province of North Brabant in the Netherlands.
Wies writes about these:
The left chart is the actual Multi Input – Multi Output analysis. There are some irregularities and inefficiencies. Therefore we made the chart on the right showing some design proposals. These are not really related to exact quantitative in or output, it’s a bit more freeminded, so no numbers are included here.
We also tried to combine the actual flows of water with the bodies of water (troposphere in the air, the bulk of ground water in the ground)
The report that contains the two diagrams can be found here. Check out p. 22 of the PDF.
Thanks for sharing this!

