The Mountain State saw the annual Governor’s Energy Summit in Roanoke on Dec 9, 2009. West Virginia relies heavily on coal, and is a net energy exporter to other U.S. states.
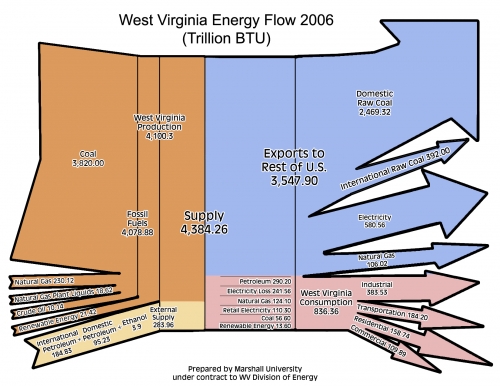
The energy flow Sankey diagram below (created by Marshall University for WV Energy Division) was presented at last year’s energy summit, and is available along with the other presentations here.
Figures are for 2006 in trillion BTU. Energy carriers used in WV are displayed as flows entering from the left. Domestic energy sources are in orange, while imported supplies are in sand color. Overall energy in 2006 was 4,384 trillion BTU. The state exported 81% of the energy (blue) and consumed 19% within (836 trillion BTU). A breakdown of doemstic consumption by sectors is shown in pink.
This Sankey diagram looks nice, but violates the basic rule for Sankey diagrams: flows have to be to scale among each other. The magnitude of the stacked orange arrows (representing 4100 trillion BTU West Virginia production) should be 14.5 times larger than that of the sand color flow (representing 283.86 trillion BTU), however it is only about 9 times larger, overemphasizing external supply (or underrepresenting domestic energy supply).
Or, compare the two arrows fro “crude oil” (10.14) and “natural gas” (230.12). The latter should have 23 times the width of the other… The blue arrow for “international raw coal” (392) looks approximately as wide as that of the blue “natural gas” (106). The scale might still be somehow OK for the base of the arrow, but as the arrow becomes thinner towards the head, the 4:1 ratio is definitely not supported any more.
