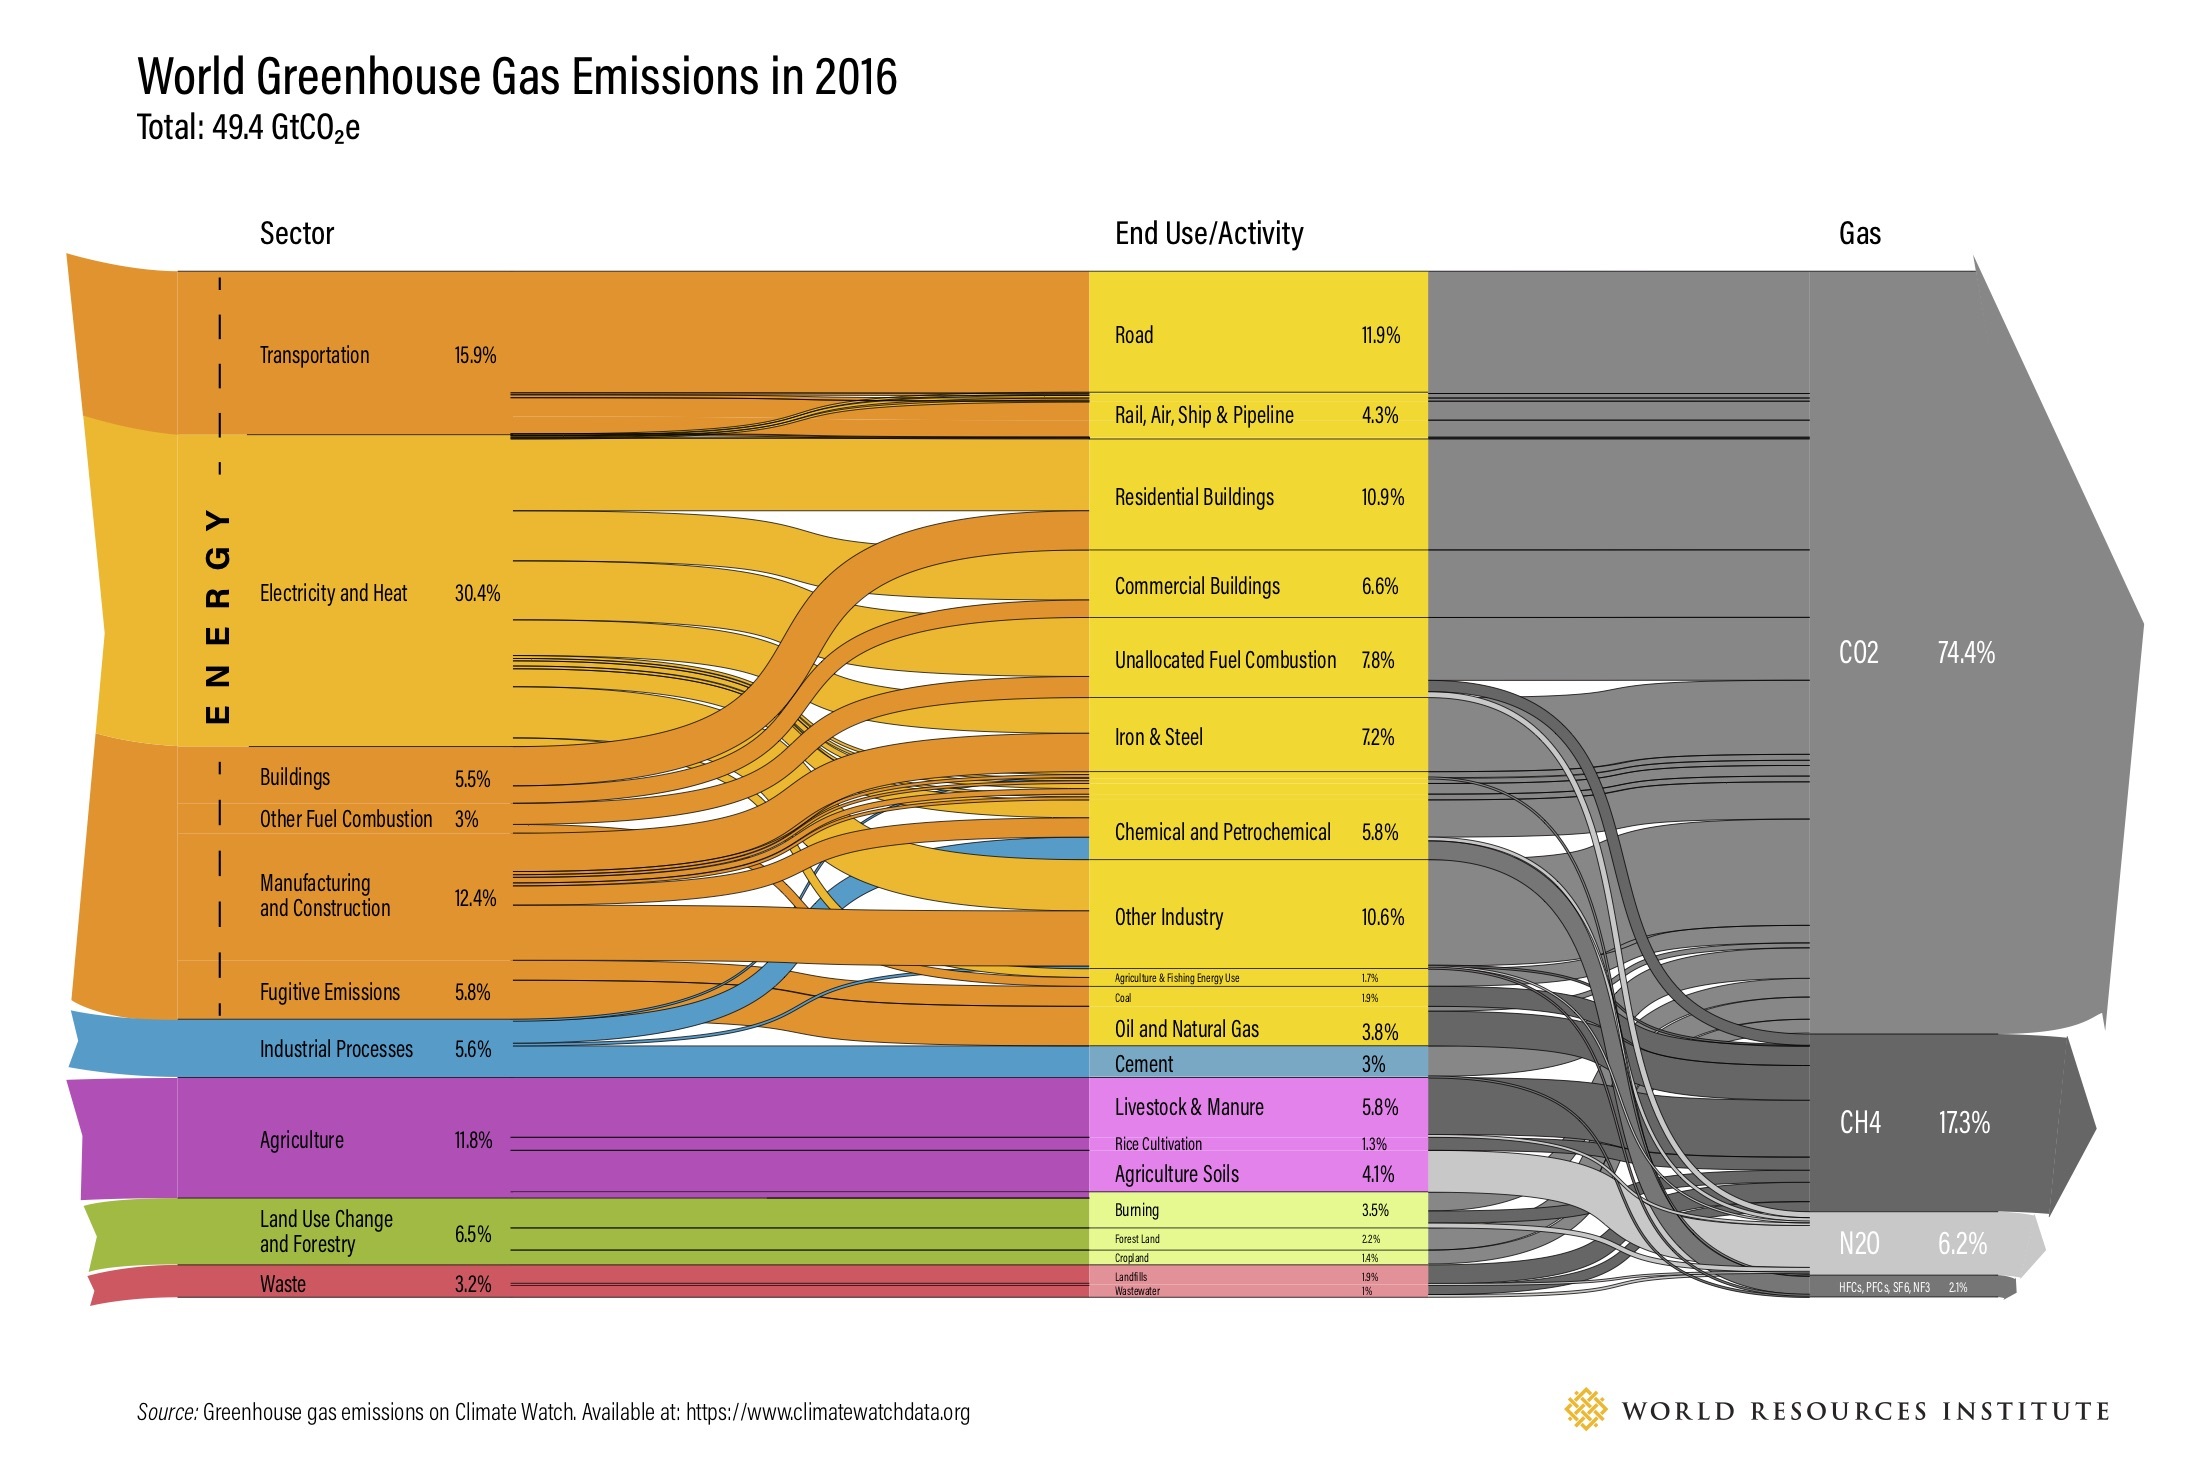
Here is an updated version of the world greenhouse gases emissions diagram for 2016. This was published 2019 by World Resources Institute (WRI) on their website.
Flows are in giga tonnes CO2 equivalents (GtCO2e). Overall emissions contributing to climate change were 49.4 GtCO2e. The first column is a breakdown per sector, the second one lists the activity causing the release. The third column shows the actual gas (GHG)
You can compare the quantities to the previous editions with data for 2000 and 2012, but mind that these figures are structured differently.
In addition to this “static” Sankey diagram there is also an interactive version that lets you explore the individual streams by hovering the mouse over the diagram.
If you like WRI’s work you might want to consider supporting them.
