For those of you interested in some of the maths behind drawing Sankey diagrams properly, you might want to read this article on ‘Programmatic Rendering of Directed, Weighted Graphs’ submitted for SVG Open 2003 by Philip A. Mansfield and Mark Ambachtsheer of SchemaSoft.
The authors consider Sankey diagrams as directed weighted graphs but they “can be difficult, time-consuming, and uninteresting to render by hand”. However, “Sankey diagrams do add an indisputable expressive power to a standard mathematical rendering of a graph…[and] when professionally constructed, Sankey diagrams represent flow in a manner … can be understood by anyone, instantly.”
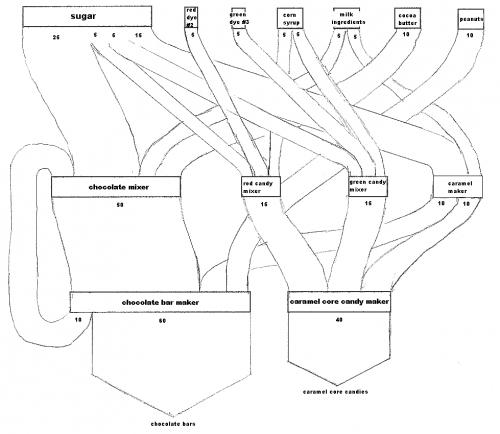
Three diagrams are presented: the first is a simple directed, weighted graph representing a candy factory:
Next, a pen-sketched b/w Sankey diagram of the candy factory…
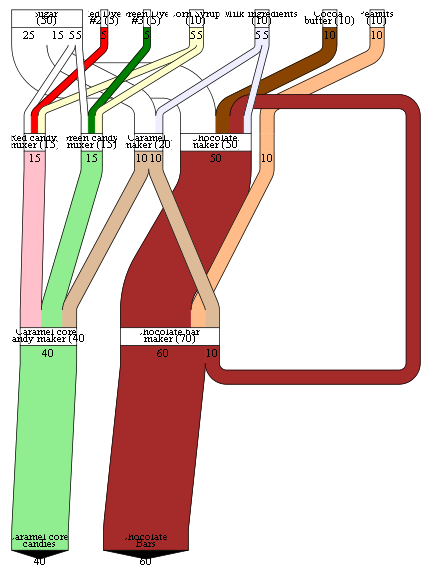
… and finally the corresponding Sankey diagram in SVG format, created using data in XML format and XSLT style sheet transformation.
They also have some interesting details on graphical problems, such as overlay, edge layout, width of Sankey arrows in curves, etc. Basically all that stuff that developers of professional Sankey software tools have to cope with.


2 Comments
Comments are closed.