I was pointed to an article on carbon footprint, that used Sankey diagrams to underline a method of carbon accounting along the supply chain. This article was part of the “first virtual global conference on climate change” CLIMATE 2008 that took place, yes, exclusively on the Internet from November 3 to 7, 2008. (I must admit that this event passed largely unnoticed by me, although reading some of the papers now gives me the impression that it would have merited more attention.)
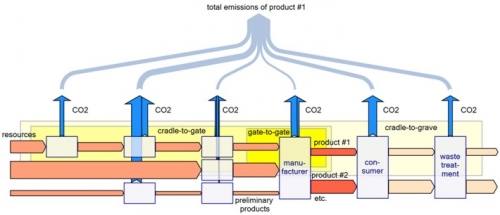
The paper titled “Carbon Accounting and Carbon Footprint – more than just diced results?” by Prof. Mario Schmidt from Pforzheim University describes the various approaches of corporate carbon accounting, carbon footprint of products, and Life Cycle Assessment LCA. Schmidt introduces a method that allows determining “cumulative emissions … at each point of the supply chain up to the POS”, and calls this the CO2 backpack.
The four Sankey diagrams above from the article illustrate the idea. They show (1) the CO2 equivalent emisisons along the supply chain, (2) the value added in a supply chain, (3) the relative CO2 emissions per value of product, and (4) the total emissions of the products along the supply chain with sectoral gate-to-gate, cradle-to-gate or crade-to-grave approaches.
This article is well worth reading, you should do so while it is still available online. Update: the domain has gone offline
Schmidt is an acclaimed expert in Sankey diagrams and has also published on the history and methodology of Sankey diagrams.


2 Comments
The best chance of making the UK a low-carbon economy comes through community-owned green energy projects. According to a collection of civil groups that represent 12 million people, government support to create a low carbon economy should be greater. Local people need a stake in energy generation and to be given the chance to produce low-carbon, low-cost energy.
Comments are closed.