Tag: metabolism

The Very Hungry Caterpillar

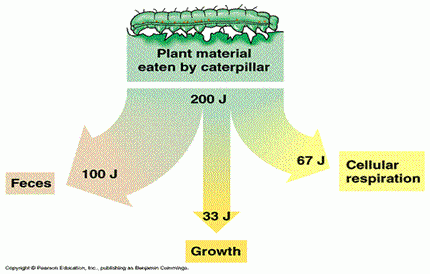
As a toddler my Mom read ‘The Very Hungry Caterpillar‘ to me, and I noticed that the book is still around today. So I thought you might like the following mini-Sankey diagram I found on an educational website.

Of all the energy contained in the leaves (or apples, pears, strawberries …) the caterpillar eats, half turns into feces, and some 33% is for cellular respiration. Only approximately 17% is for growth of the caterpillar. It seemed more than that to me at the time…

Participatory Urban Metabolism Information System

Interesting project described in the blog article ‘Understanding your city by understanding its flow: towards Participatory Urban Metabolism Information Systems’ by Sven Eberlein of the Ecocitizen Worldmap Project.

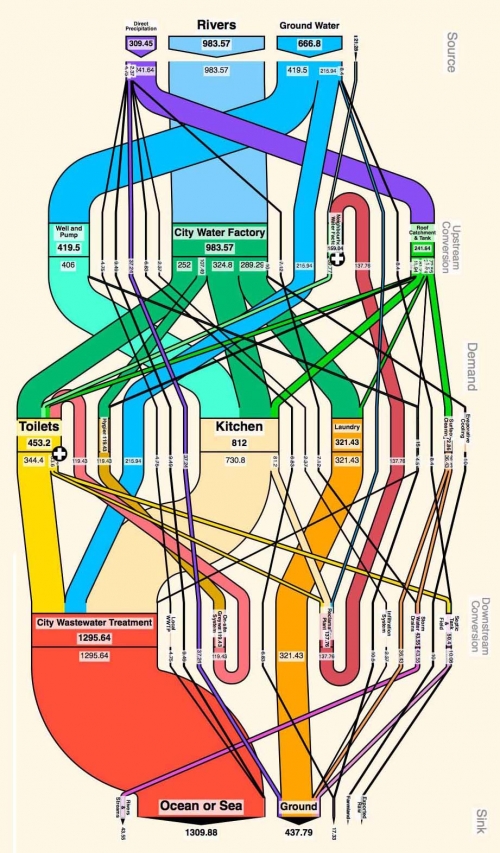
This is a participatory approach where young citizens track the water flows in their city in a crowd-mapping approach. The data is visualized as Sankey diagram (here called MetaFlow diagram). Pilots were carried out in Casablanca and Cairo.

This project is somehow linked to Sebastian Moffat’s activities I have featured in a blog post back in 2008.

This seems to be the result from either the Casablanca or the Cairo field work. Great colorful Sankey flow diagrams. Judging from the photos in the blog post, working with the local community seems to have been fun. The participatory approach is emphasized (Sven calls this a ‘Participatory Urban Metabolism Information System (PUMIS)’).

More Sankey diagrams can be seen in the original blog post.

Contres Territorial Metabolism Sankey

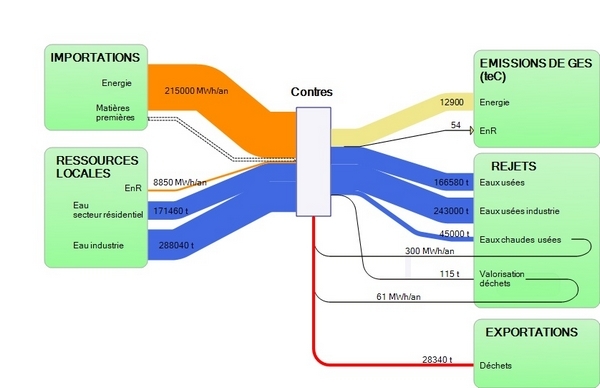
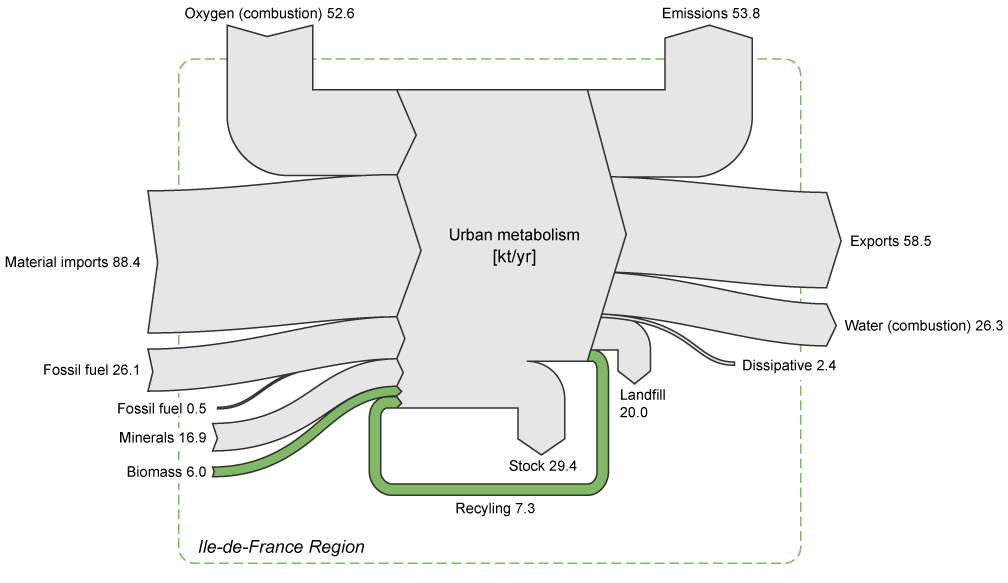
After my last post on the Paris Urban Metabolism I continued to research that topic a little more. I came across another example from France. The below Sankey diagram is from an article on territorial metabolism in the rural village of Contres in France. (“H4 développe une démarche de métabolisme territorial à Contres”).

In this study, the consultant company H4 Valorisation analysed the material and energy flows liked to the villages economic and agricultural activities. Different scenarios were evaluated, focusing primarily on (1) reducing imports and rejects (waste and pollutants), (2) increasing usage of local resources, and (3) looking at reuse of material internally (les rebouclages internes).

The Sankey diagram shows both mass and energy in one diagram, so the inputs and outputs of the central node (representing the village of Contres) are not balanced when summed up. Mass flows are in tons (per year?) in blue and red colors. Energy is in Mwh per year and shown in orange color. Greenhouse gas emissions from energy used is also represented in pale yellow expressed in tonnes of CO2-equivalents.

Metropolitan Energy Flow Sankey Diagrams

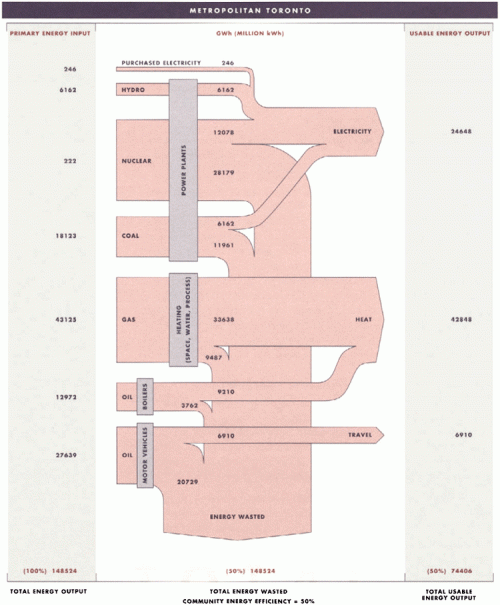
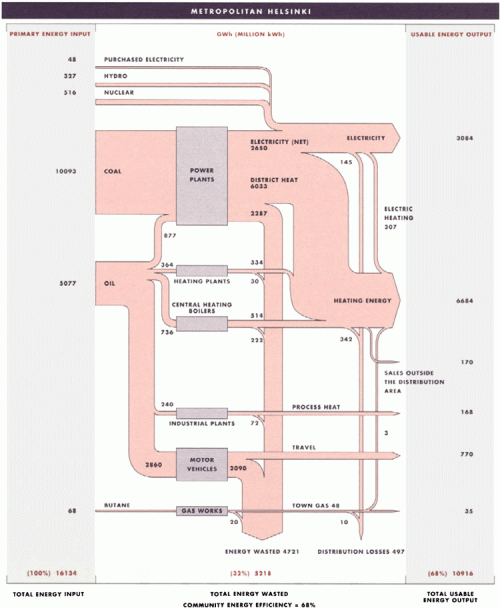
I have posted several Sankey diagrams depicting the energy flows of countries. At least California and West Virginia have published state energy flow Sankey diagrams. I was quite excited to discover the two metropolitan energy flow Sankey diagrams shown below in this publication. They are for Toronto and Helsinki and show energy flows in 1988 in these communities.

The two diagrams show energy consumption and use in Toronto (above) and Helsinki (below). Even though the absolute figures in GWh are given, one shouldn’t directly compare them. A per capita basis would be fairer (Toronto had a population of 2.5 mio in 2006, more than 5 mio. in the metro area, while Helsinki had 580.000 inhabitants in 2008 in the city, 1.3 mio in the greater Helsinki area — Toronto is today 4.5 times larger than Helsinki). Both are “cold-climate municipalities”.

The publication calculates a ‘community energy efficiency’ of 50% for Toronto and 68% for Helsinki. “A comparison of the two municipalities reveals that Helsinki significantly improved its efficiency by using the waste heat that is produced by local coal power plants to warm 90% of the buildings and homes in Helsinki. Further analysis has demonstrated that Helsinki’s energy system was able to achieve its overall level of 68% efficiency because the city’s compact land-use pattern made investments in energy-saving infrastructure, such as district heating and public transit, economically viable.”

Does anybody know other metropolitan energy flow studies? I am aware of research activities in the field of urban material flow accounts or urban metabolism (e.g. Lisbon) but have to check whether they show Sankey diagrams in their publications.

Water Balance (or: Metabolic Profile Sankey)

This article on “Conceptualizing the built environment as a social-ecological system” by Sebastian Moffatt (CONSENSUS Institute) and Niklaus Kohler (University of Karlsruhe) published in Building Research & Information, Volume 36, Issue 3 May 2008 , pages 248-268 has an exciting Sankey diagram in the section ‘Current perspectives, promising methods, missing pieces’ (scroll down about half way).

The authors explain Sankey diagrams as an instrument of Material Flow Analysis (MFA)

“Sankey (directional flow) diagrams are often used to summarize the MFA visually as an entire connected and balanced system. In a Sankey diagram the material flows begin with inputs from nature, then flow into intermediary processes (any infrastructure used for processing, converting, storing, or regulating), and then into the various end use(s). After use, flows may be reconverted by infrastructure systems for reuse or recycling. Ultimately, all flows are directed to a category of output (waste products emitted into air, into water bodies or into landfills; long-term storage; export). The balanced accounting thus tracks every flow from source to sink.”
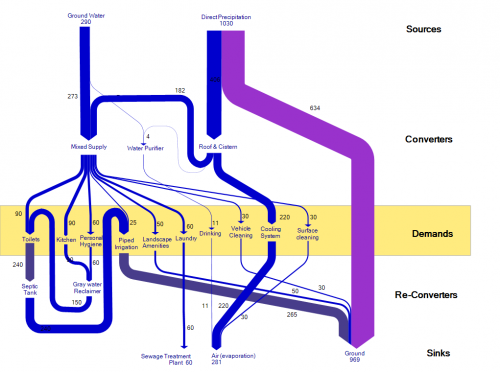
The original Sankey diagram shown in this article is for an resource efficient house, planned or built in New Delhi (India). It sports the water flows through five groups of processes (sources, converters, demands, re-converters, and sinks). The authors call it a “five-partition metabolic profile”, and suggest that it can be done not only for a single house, but “for the built environment at any scale, from parcel to urban region”.

The unit for the quantities given is not indicated, but I presume the water flows are in litres.

When reproducing the Sankey diagram (see above) I tried to make it a little more clearer by changing the order of the (invisible) nodes, thus avoiding crossing flows.