Tag: energy balance

LatAm BEN – Costa Rica

Here is an add to my mini-series on energy balances of Latin American countries. I had previously featured Costa Rica’s balance energetico nacional for 2010. So here is an updated version for 2015.


This is from a report ‘Matriz Energética de Costa Rica. Renovabilidad de las fuentes y reversibilidad de los usos de energía’ by Diego Zárate Montero and Remigio Ranírez García’ published October 2016 (available here). Flows are in TJ, and data from the Dirección Sectorial de Energía. This 2015 version is based on the design of the 2010 version, and you can compare them directly to see, for example, changes in energy consumption per sector.

Energy Balance La Réunion 2018

Two years ago I posted an early version of the energy balance for the French overseas region La Réunion, an island in the Indian Ocean. Visiting the website of Horizon Réunion (formerly Energies Réunion) now, I am happy to see that they have taken the elaboration of the energy balance much further, and are now publishing this detailed Sankey diagram for energy flows in 2018.

The diagram has been created by Observatoire Énergie Réunion (OER). Flows are in ktoe (ktep, kilo tonne d’équivalent pétrole in French). Overall primary energy for the island was 1441.8 ktep, of which 87% is fossil and 13% from renewable sources. We can see that mobility is the largest chunk of energy use with 64.5%.

You can access the full report with all background data here.

LatAm BEN – Honduras

Some time has passed since the last post in my mini-series featuring energy balances of Latin American countries. Panama was last in July 2019. So today, here is the Balance Energético Nacional (BEN) for Honduras.

This Sankey diagram can be found on page 43 in the report ‘Balance energético: un panorama del actual sistema energético hondureño’ (2018) published by Secretaría de Energía, Gobierno de la República de Honduras.

The figure shows energy origin (left column), energy type (middle column) and consuming sectors (right column). Individual streams are not labelled with quantities, but all the numbers are in the report on the previous pages. Overall final consumption of energy in 2017 in Honduras was 33.376 kbep (kilo barrels of oil equivalents). We understand almost half of the energy was imported.

Some observations that possibly only strike a nitpicking observer like me: Streams sometimes don’t maintain their width when sloping upward or downward (an indication that d3.js sankey has been used to draw this). The flow depicting electricity export goes back to the left (green node ‘Exportación’). Nodes for tiny flow quantities are amplified, so please don’t take the middle column as a stacked bar. Otherwise a fine diagram. I like the icons used for describing the energy types and different uses.

Energy Flows Germany 2018

Energy consumption in Germany is tracked by AG Energiebilanzen (Working Group on Energy Inventories) and a Sankey diagram is published annually. This is the latest one for 2018 featured on their website.

And again, it leaves me disappointed… Why does such a prestigious group as AGEB, that has been in the business of producing energy inventories since 1990 and energy flow diagrams at least since 2013, if not longer, produce Sankey diagrams that are not to scale?

LatAm BEN – Panama

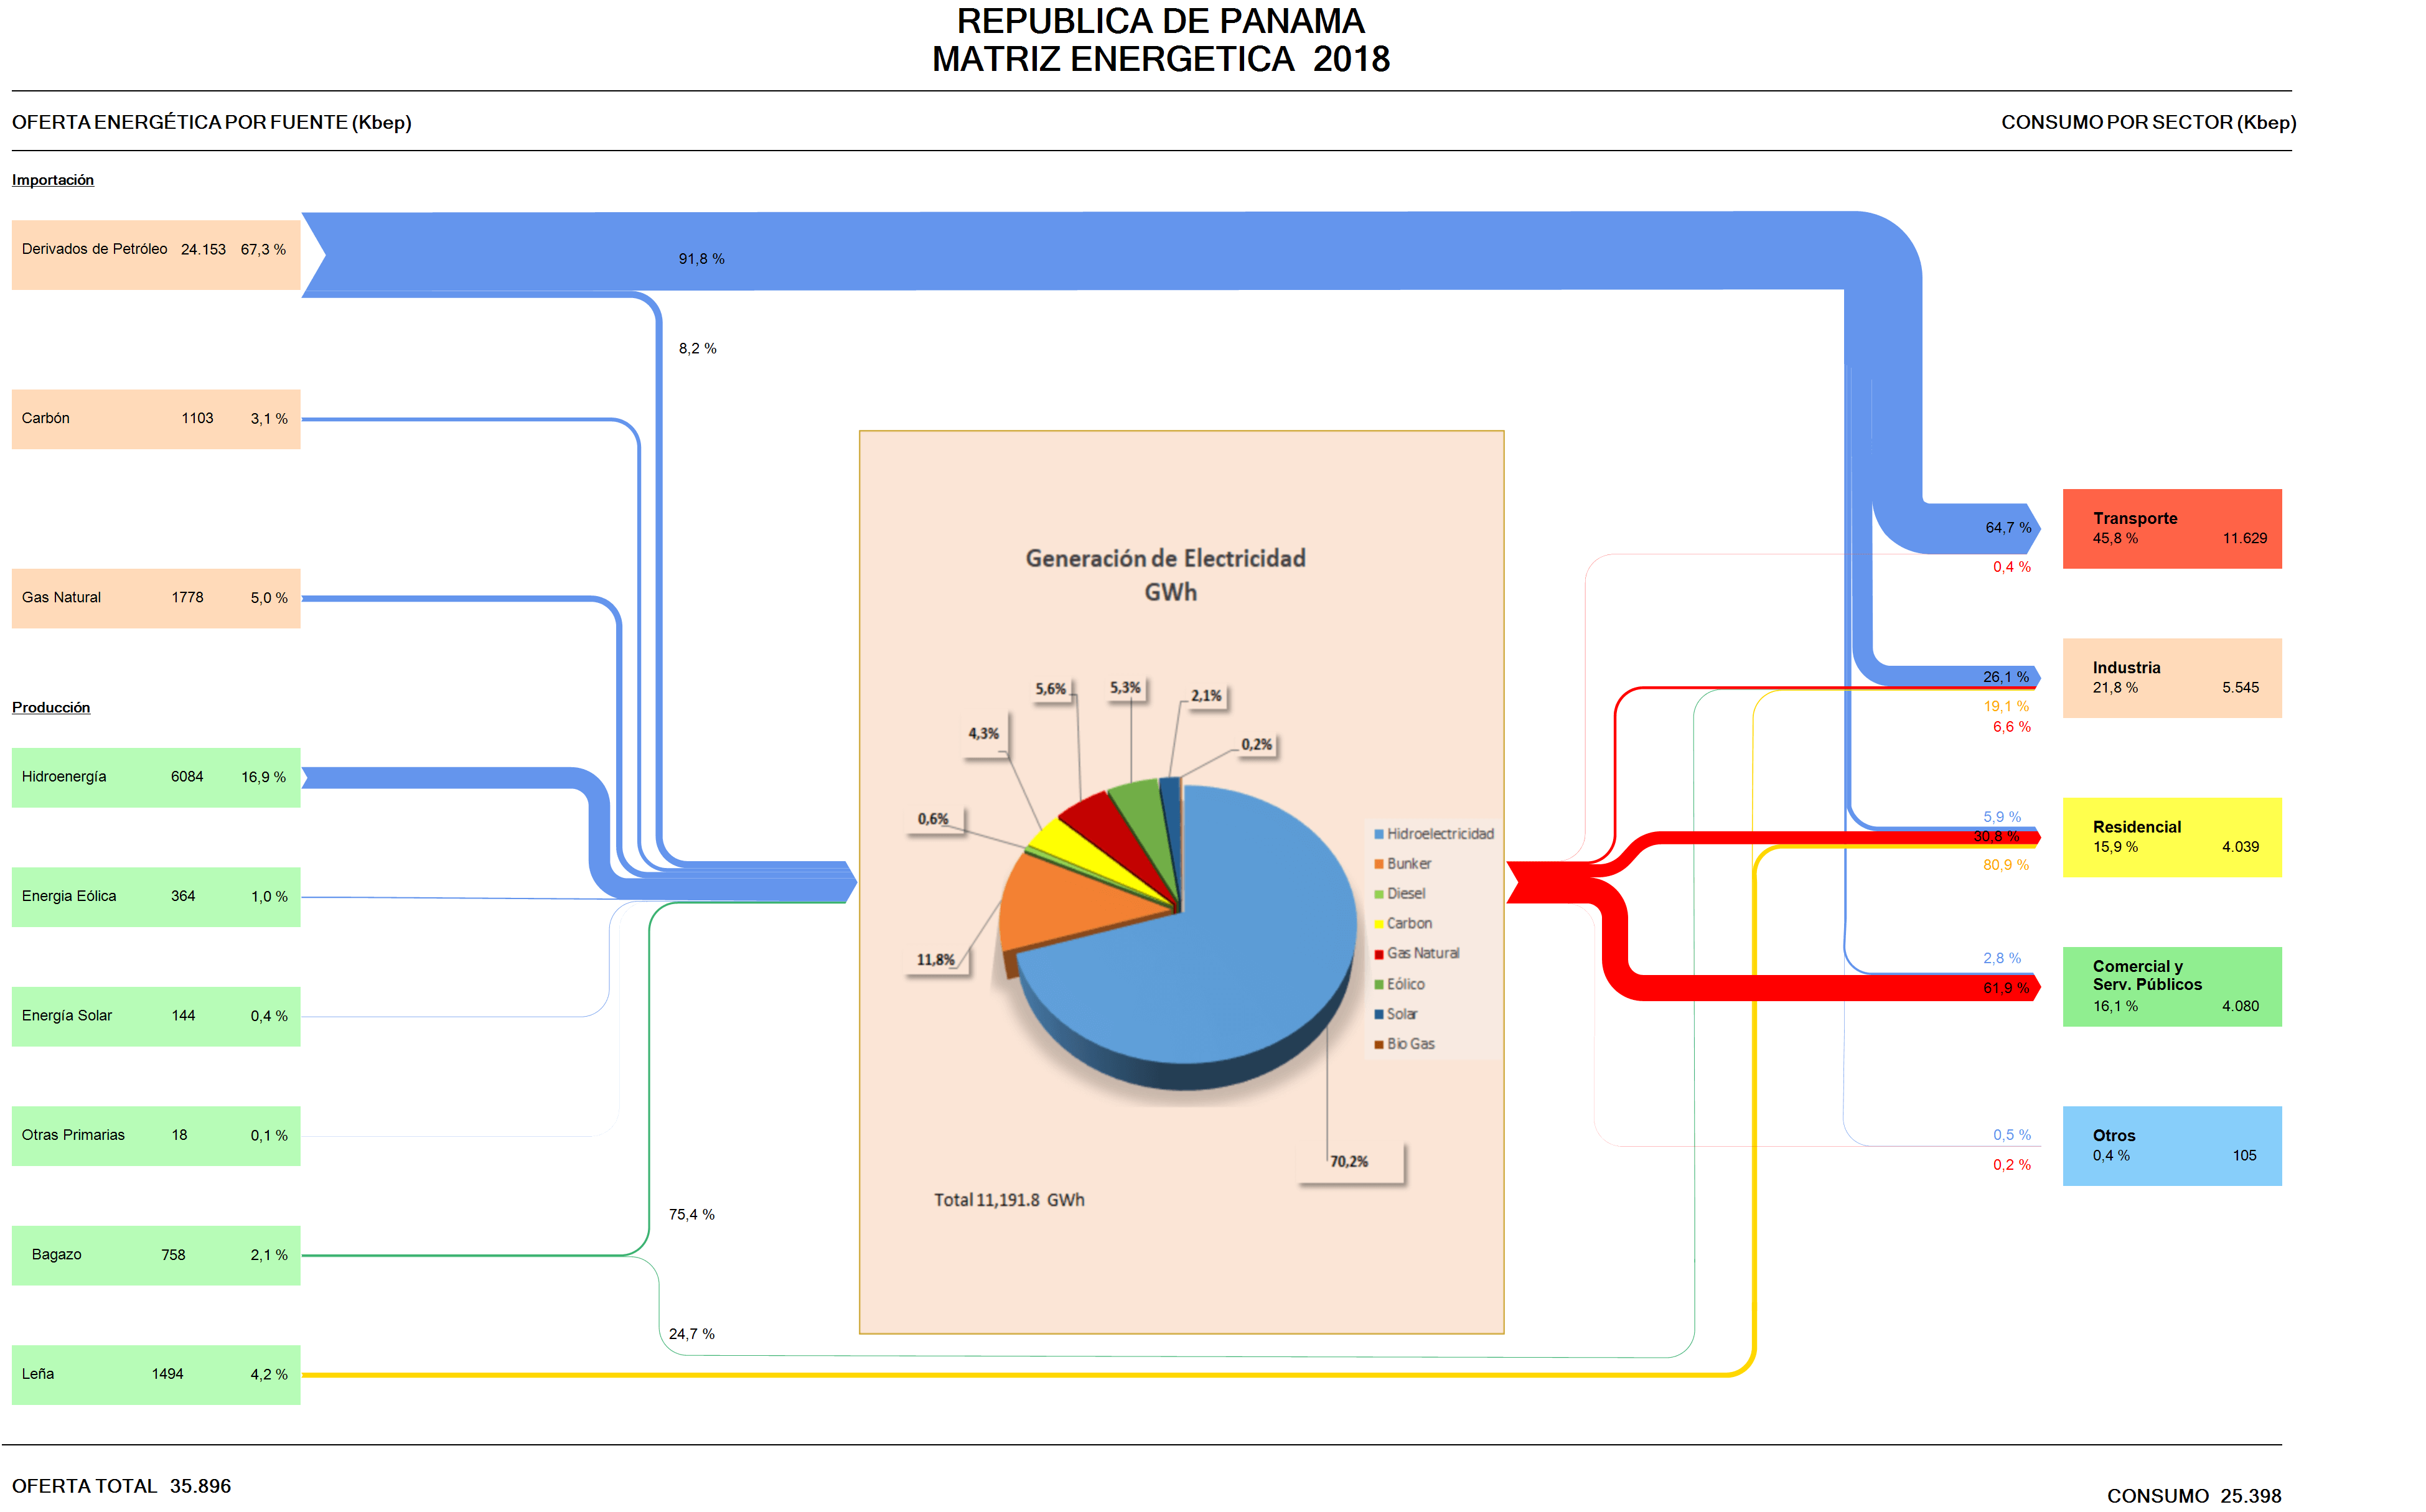
Skipping the remaining countries in South America (Venezuela, Guyana, Suriname, French Guiana) for the time being, my series of Sankey diagrams depicting the National Energy Balance of Latin American countries continues with Panama.

Data for the Balance Energético Nacional (BEN) is available on the website of the Ministry of Energy (Secretaría Nacional de Energia), but I could only find this visual representation of the Matriz Energético done in Excel.

Arrow lines are all the same width and glued together from horizontal and vertical line segments. To be featured here on the blog, it has to be some kind of Sankey diagram, with the magnitudes of the arrows or bands representing the flow quantity.

I checked the sieLAC page maintained by OLADE, but there I could only find energy flow diagrams up to the year 2010.

So I decided to “translate” this Excel figure (which has all the numbers) into a Sankey diagram. As it turned out, the work wasn’t straightforward, since this figure uses two, actually three different units. Primary energy on the left and consumption per sector is in kbep (kilo barrels of oil equivalents). The pie chart in the middle that represents the electric energy generation is just an insert with data in GWh. The arrows in the Excel figure are labeled in percent. I started out using the kbep scale, but then was unable to convert the quantities for the streams, since actually energy losses are omitted in the figure.

Here is my remake:


I chose to work with the percentage scale for the downstream splits per fuel, setting the magnitude of the energy generated at the same size as the input. We can see that the energy landscape is dominated by imported petroleum derivates consumed for transport. Actually this is almost three times as much energy as is being used for energy generation. Domestic energy production is mainly from renewables with only some coal and natural gas.

Colors and general layout of the remake stick pretty much to the original figure.
LatAm BEN – Colombia

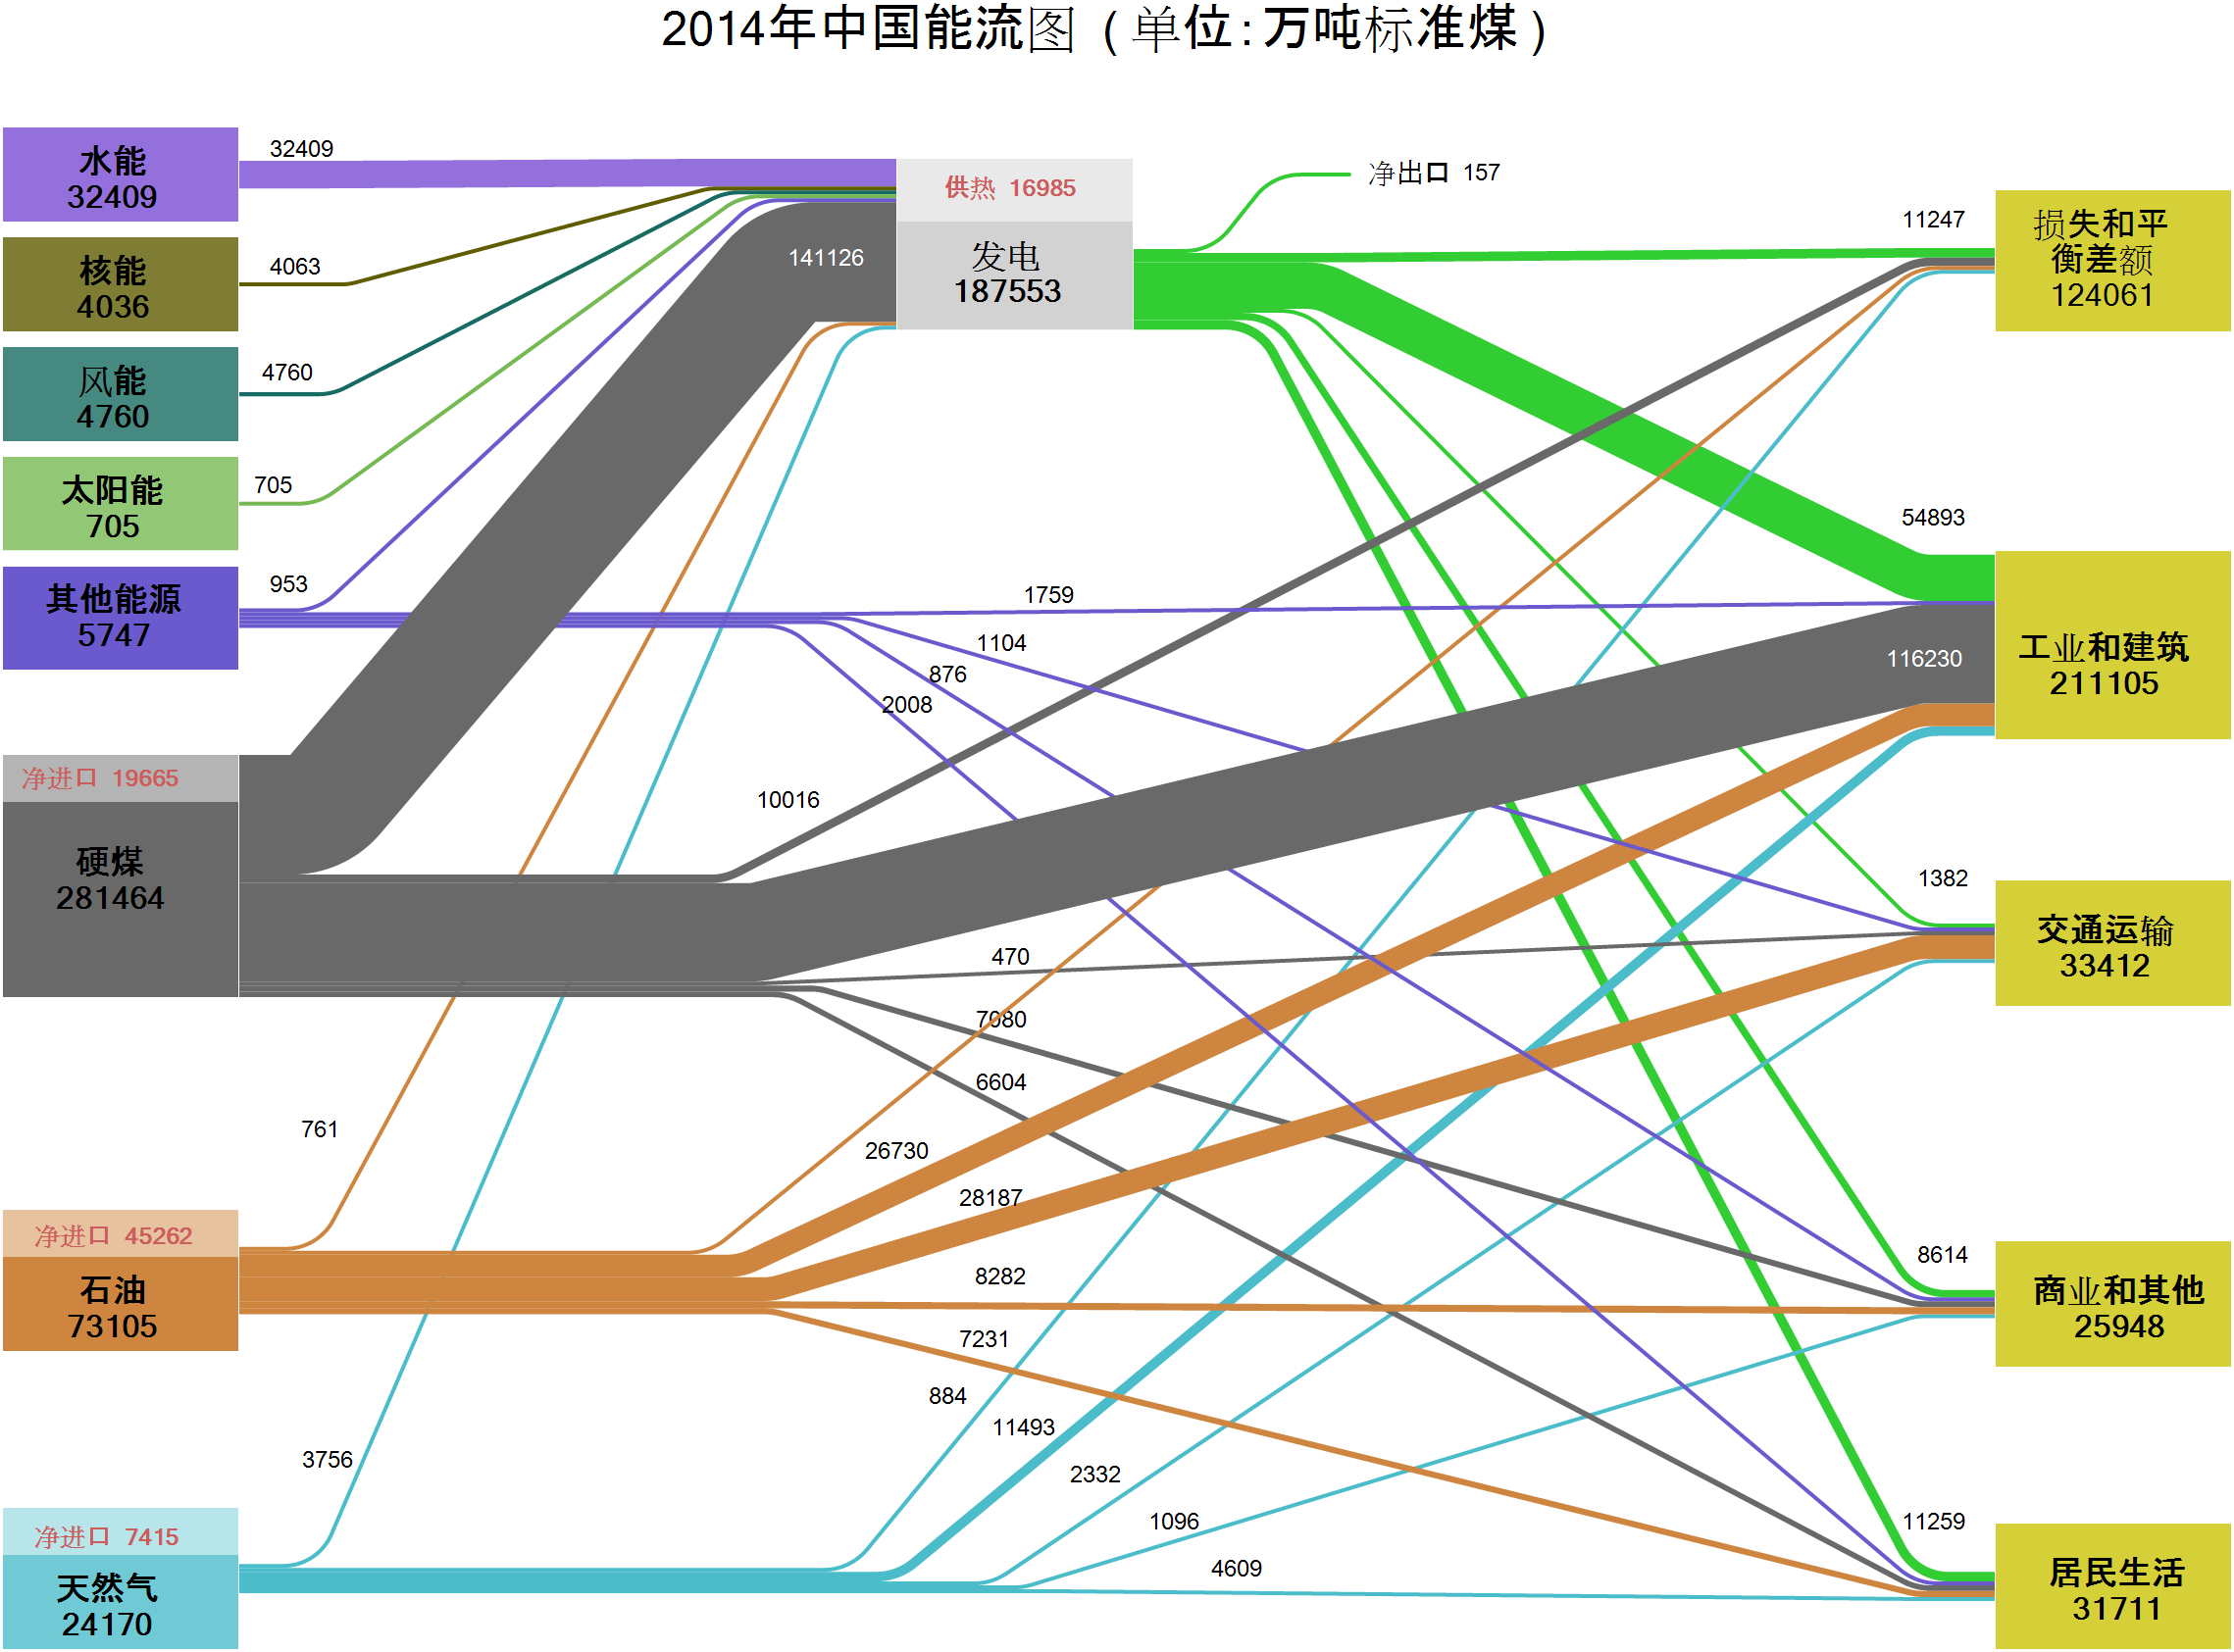
Colombia is next in my mini-series on National Energy Balances (Balance Energético Nacional, BEN) of countries in South and Central America.

Searching for an energy flow chart for Colombia brought up a lot of data and publications by UPME (Unidad de Planeación Minero Energético), an agency of the Ministerio de Minas y Energía (MinMinas). However, finding an actual energy flow chart turned out to be more difficult. I finally found one for 2012 in a presentation ‘Potencial energético colombiano para la generación de energía y su óptimo aprovechamiento’ by UPME on a U.S. National Institute of Standards (NIST) website.

With Colombia being an energy exporter, they seem to have been facing the same problems as Bolivia and Ecuador when drawing the Sankey diagram: The comparatively much larger energy export quantity kind of dwarfed the other flows of the Sankey diagram. Hence, in the same presentation, they excluded the export stream and focused on the domestic energy flows.

Flows are in terajoules (TJ) for the year 2012 in both diagrams. The scale of the two diagrams is not the same, so they must not be compared to each other. What has been reduced to tiny streams and hairlines by the massive export flow in the first diagram, received more weight in the domestic energy flow diagram.

A good solution to a general issue when handling flows with huge differences in the same Sankey diagram.

LatAm BEN – Ecuador

Here’s the continuation of my mini-series on Sankey diagrams showing energy balances of Latin American countries. After my recent post on the Balance Energetico Nacional (BEN) of Bolivia the neighbouring Peru would be next. However, I have presented a Sankey diagram on energy flows in Peru on this blog before. So today, here is the BEN for Ecuador. It is published every year by the Ministerio Coordinador de Sectores Estratégicos.


Data is for 2016. The unit of flows is ‘kbep’ (kilo barrels of oil equivalents / miles de barriles equivalentes de petróleo). The appearance is very similar to the BEN Bolivia I showed here.

Again the flows are not to scale, which is a pity. Smaller flow quantities (in the range of 0 to 1000 kbep) are shown as arrows with a minimum width, which is fair, because otherwise we wouldn’t see much more than a hairline for ‘Solar’ or ‘Eólica’. However, if you look at the light grey flow of 17,533 kbep derivates exports branching out after the refineries node, it has the same width as the arrow representing 3,024 kbep of own use (consumo própio) – although it should be 5 times wider. The orange arrow depicting 4,433 kbep of natural gas on the other hand is wider than the one 17,533 kbep derivates exports…

I really like the graphical aspects of the Sankey diagram, and I admire the effort made here to come up with an annual Balance Energetico Nacional. In my opinion, not showing the flows to scale thwarts the whole effort, and makes using this diagram type superfluous. I know that doing such a Sankey diagram to scale is sometimes challenging, in particular when there is a very large dominating flow (like here the 139,046 kbep petroleum exports), but nevertheless, the message you are otherwise conveying with the figure is simply misleading.

Just as for Bolivia I will again have to draw this one myself …