Tag: building

Passive House School Building in Germany

Sankey diagrams from Germany (and in German) can be found abundantly on the web (try a Google image search for ‘Energiefluss Sankey Diagramm’). So, when lagging behind or short of time I sometimes pick one for a Friday afternoon post.

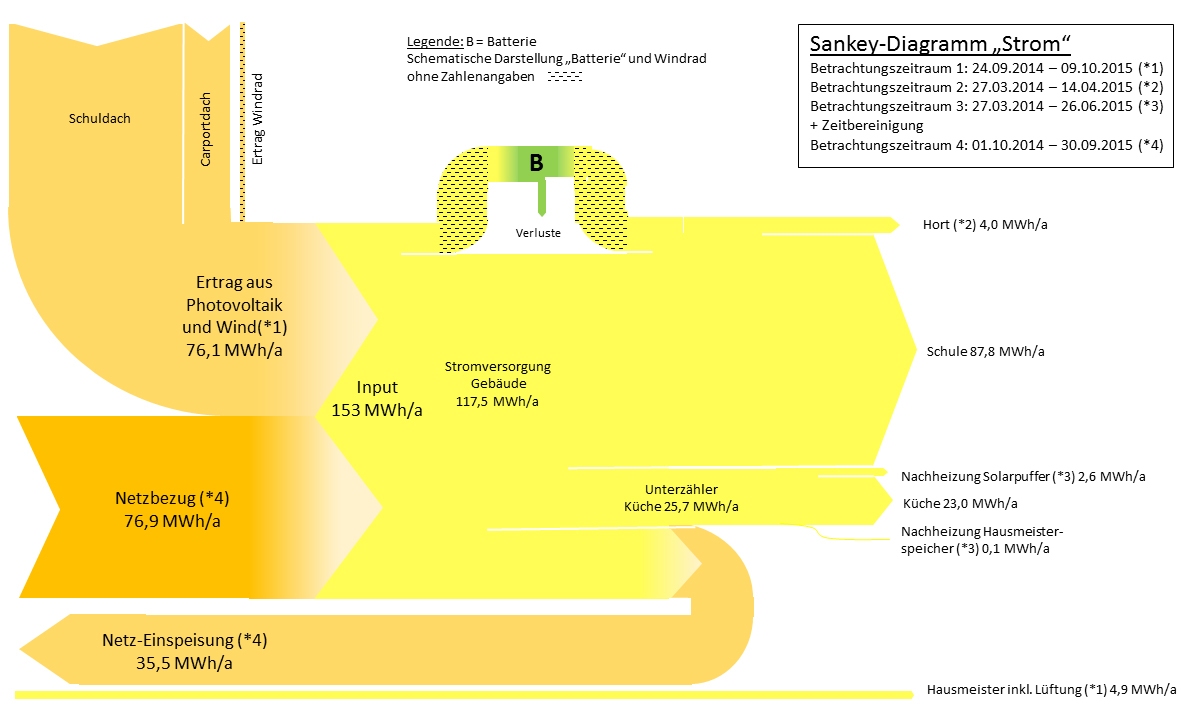
Here is one I found on the web page of ‘BINE Informationsdienst’, a resource portal for energy research and examples from practice. This Sankey diagram produced by Hochschule Magdeburg-Stendal.

This energy flow Sankey diagram is for the first school in Germany built in 2014 according to Passivhaus standard in Halle. Flows are in MWh aggregated over a 12 month period. Energy harvested from solar panels on the school’s roof and a wind turbine were 76.1 MWh, with energy from grid amounting to 76.9 MWh. However, 35.5 MWh could be fed back to the grid (Netz-Einspeisung).

Living Sankey Diagrams

A reader of the blog, Olov, has produced the following video. He calls this a “Living Sankey Diagram”. The background can be found on the Sweco Blog (in Swedish). Basically he suggests to take energy declarations for buildings (‘Energideklarationen’) one step further and have visual energy monitoring for building using realtime data.

Energy consumption of a house is shown over a period of a year with up to 3 or 4 datasets per day. We can see heat (red) and electricity (orange). Not sure about the temperature indication at the top left, possibly meant to be the difference to a default temperature (Olov, if possible, please explain by commenting below).

Main consumers in the building are hot water generation (‘Tappvarmvatten’), room heating (‘Radiatorer’), ventilation and cooling. Some PV cells (‘Solceller’) at times add to the purchased energy (‘Köpt Energi’). The pink flow shows heat recovery (‘Värmeåtervinning’). The building is classified in energy class B.

Here, a data series has been used to produce the Sankey diagrams and then the frames were converted to a video. This makes for a nice effect and allows watching your energy flows in retrospect. For example, the PV cells feed energy mostly during the months, while in the same period heat demand and recovery is very limited.

This was apparently produced using e!Sankey. To really do an energy monitoring and produce the Sankey diagram every couple of minutes, there is a software development kit (SDK) the allows linking to a data source (energy measurement data) and pushing the “living Sankey diagram” to a website. Another example can be found here.

Building Energy, Simple Sankey Diagrams

From my collection of Sankey diagrams here are three very similar samples depicting energy flows in a building. All three are from Germany (did I mention that more than half of the Sankey diagrams seem to be from Germany or Austria?).

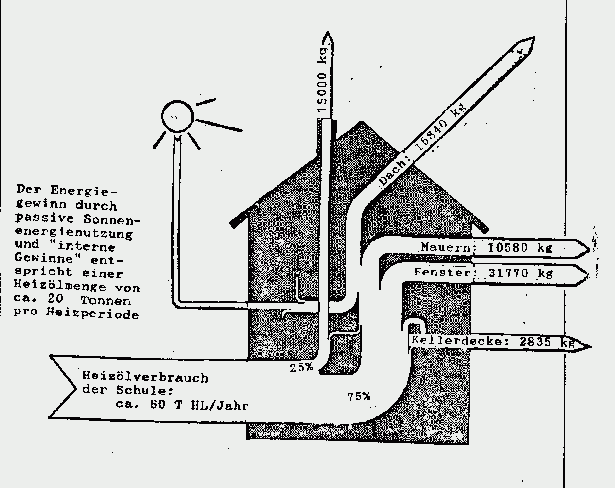
These are all very simple Sankey diagrams. This first one is a hand-drawn goodie from the times when reports were still done with a typewriter. It shows use of fuel oil (‘Heizol’) in a school building, and interesting to see, the flows are given in kilograms fuel oil rather than to represent the heating value. The school building consumes 80 tonnes of fuel oil per year.

Note that flows are not to scale (arrow for equivalent of 10580 kg fuel oil annual heat loss through walls is about the same width as the one representing 31770 kg heat loss through windows). So this Sankey diagram doesn’t deserve an A…


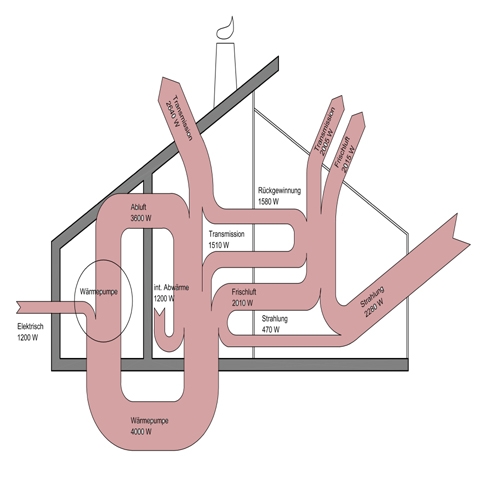
The next building energy flow Sankey diagram shows flows in Watts (W). Not sure where I found this one. Flows again are not proportional (spot the 470 W flow and compare it to the others). Main inputs are radiation (‘Strahlung’) and electric energy. A heat pump cycling energy can be seen, so it seems that this one is maybe for a passive house.

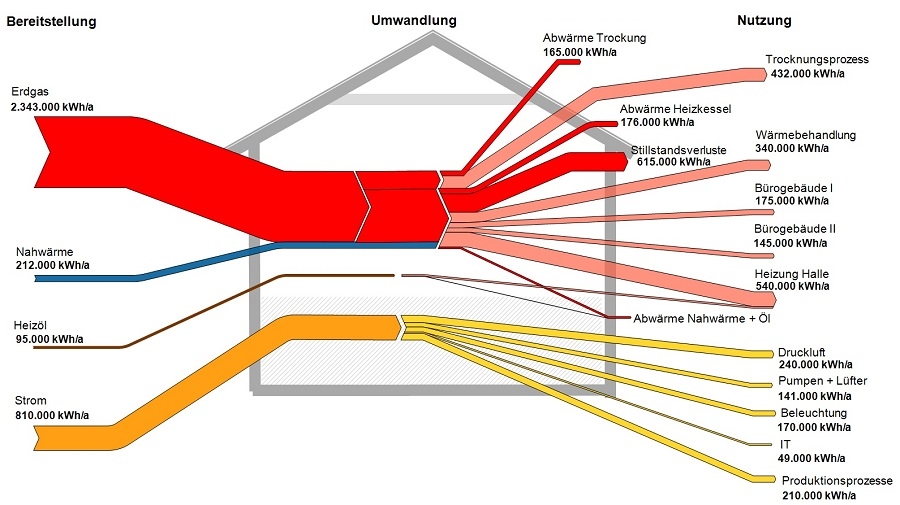
This last one done with a Sankey diagram software hence flows are to scale in this one (although I have some doubts regarding the width of the fuel oil input arrow on the left). Flows are in kWh per year. Main fuel type is natural gas (red), some district heating (blue). Electric energy in yellow, consumed by IT, lighting, air compressors, and so on. This energy flow Sankey diagram is probably for a factory building or complex.

I will try to add the sources where I found these three diagrams. Please forgive my negligence this time.
Building Thermal Energy Model, Sankey Fail

A Swiss software company features a screenshot on their website, depicting a thermal energy model for a building. I’m not mentioning the source, because it is a bit embarassing…

Despite the general good impression of the diagram and the tech labelling of the arrows, the width of these arrows seems completely arbitrary. Well, to be fair … they don’t call it a Sankey diagram.

Visualizing Internal and External Heat Flow

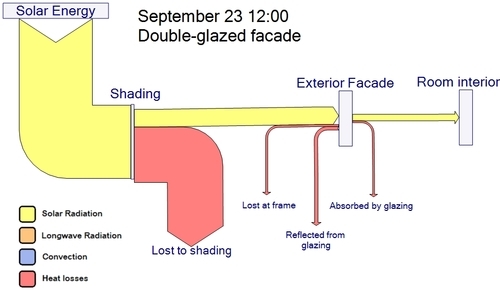
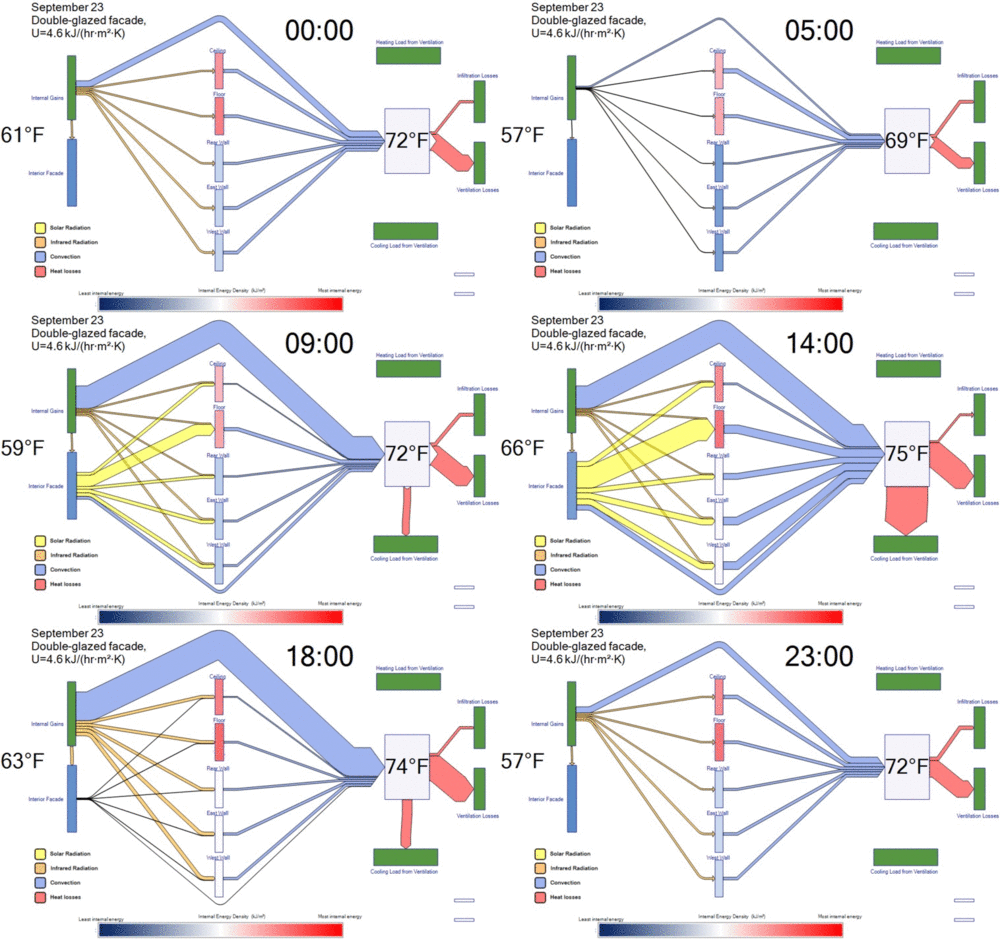
This post on the Transsolar ‘Green & Sexy’ blog features two Sankey diagrams. The “climate engineers” at Transsolar use them to model heat flows inside a building based on outside temperature and solar radiation.

No absolute values are given in these demo Sankey diagrams, but one can still get a general idea by observing proportions. Flows are color-coded with solor radiation in yellow, convection in blue, and heat losses in red.

The second Sankey diagram shown is a timeline made 24 frames – one per hour over a full-day. As the outside temperature rises and solar radiation increases around noon, the inside temperature and cooling demand increases.

(via tumblr)

Sankey diagram timeline by Transsolar

The authors explain:

“These Sankey diagrams allow us to see the proportion of how much energy is hitting the facade, how much energy is being radiated into the walls, how much energy is being convected into the air, and how much heating or cooling is actually needed to maintain an acceptable indoor air temperature. The animation is the first example we’ve ever seen of a Sankey diagram that represents the dynamic, ever-changing relationship of heat flows in a building with time.”

Recyclability of concrete, timber, steel

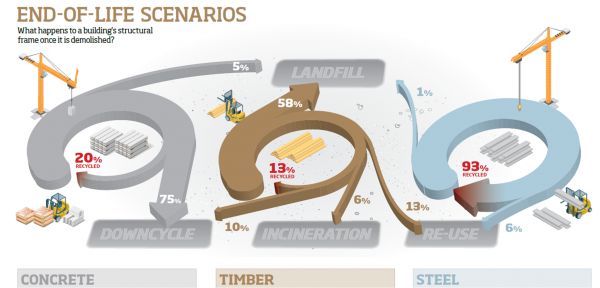
Nicely made infographic from steelconstruction.info wiki. What happens to the building materials on demolition, how much of concrete, timber and steel can be recycled?

The three arrows are curved and start at a 7-o’clock position. Used concrete from building demolition is mostly downcycled. Wood from structural frames is mostly landfilled, or re-used. Steel has a very good recyclability and most of the material can be recovered to make new steel.

The view angle and the images of construction machines make it a very attractive infographic.

Energy Flows in Building Sector

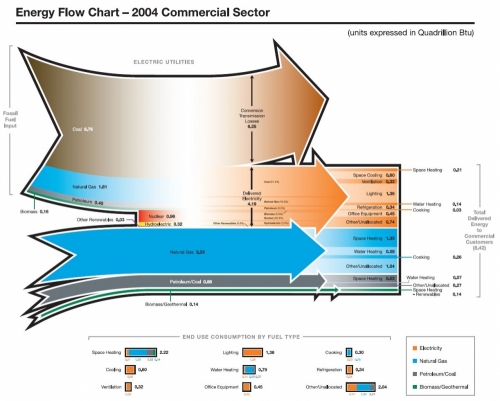
An energy flow chart for energy use in the residential building sector is shown on the Autodesk Sustainability Workshop page ‘Measuring Building Energy Use’. There is also a similar Sankey diagram for energy sources consumption in the commercial building sector.

Both are taken from a Pacific Northwest National Laboratory (PNNL) report from 2006 prepared for Department of Energy (DOE) titled ‘Energy End-Use Flow Maps for the Buildings Sector by D.B. Belzer (PNNL-16263).

Residential building sector energy flow chart:

Commercial building sector energy flow chart:

Both Sankey diagrams are built up the same way. The top part of each diagram shows electricity generation, the bottom part the energy flows for heating. Significant conversion and transmission losses can be identified by the arrow branching out at the top. Flows from the left represent the energy sources: coal (brown), natural gas (blue), biomass/solar (green). To the right the flows are broken down to the individual consumption, such as heating, cooling, lighting, other electric appliances, etc.

All units are in quadrillion BTUs for the U.S in 2004.

Building Energy Measuring and Modelling

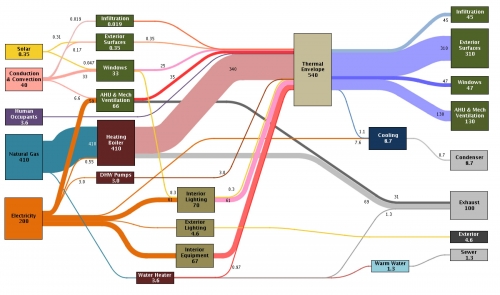
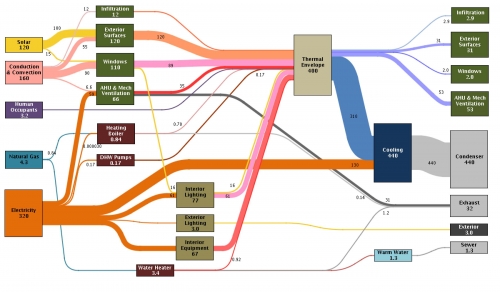
This article on ‘A Pilot for Measuring Energy Retrofits’ describes how researchers from the EEB Hub used an old navy building in Philadalphia to “determine detailed system performance”.

EEB Hub researchers outfitted Building 101 with sensors and a data acquisition system to determine detailed system performance, building energy loads, indoor environmental quality (IEQ), and a detailed operation of the building control system. … The sensors read data from 509 sensing points, collecting 1,048 pieces of data at one-minute intervals. These data points track indoor air quality, occupant comfort, and building energy use.

The result of that “inverse modelling” (i.e. measuring) approach are presented in Sankey diagrams and are used “to identify discrepancies in the predicted versus actual energy balance”.

There are significant differences between the January energy use…

… and the energy picture in July

While in winter mainly natural gas is used for heating, the gas consumption in summer is down. In July electricity consumption is significantly higher due to air conditioning.

Unfortunately no unit of measurement is given (it could be kWh), but nevertheless proportions of the energy flows are correct.

Read full article.