Tag: finance

Adyen Income Statement Sankeyfied

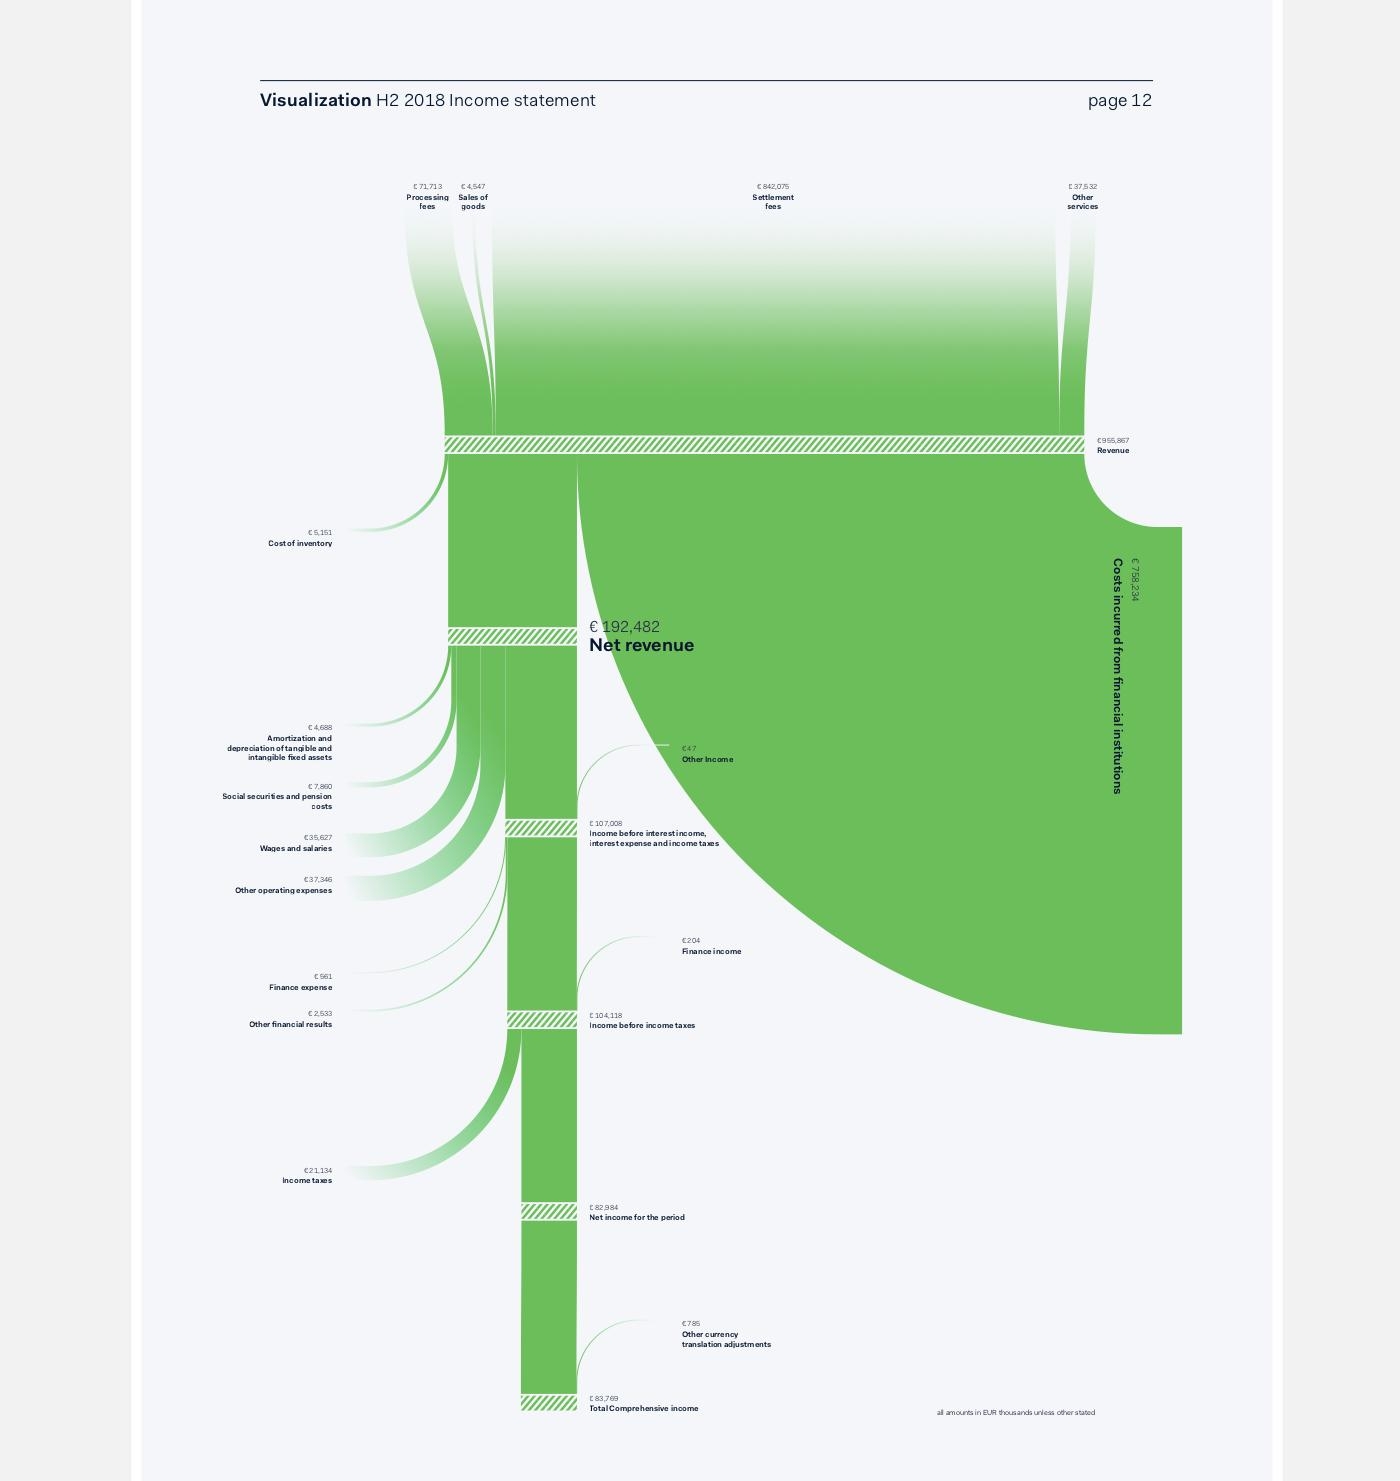
Amsterdam-based graphic designer Nadieh Bremer (a winner of a 2017 Information is Beautiful award) has created this Sankey diagram for the H2 2018 shareholder report of Adyen.

Definitely a novelty in a financial report (at least I have never seen a Sankey diagram in a such a publication).


via Twitter @NadieBremer

Apart from the fact that it is beautifully crafted and clean, it is also quite a tweak of the d3.js Sankey library … After all, this is not the typical d3.js Sankey diagram (with left-to-right orientation, only with boring grey bands, or even arrows superimposing each other where they curve). Here we have a top-to bottom flow, with streams branching out to the left and to the right, flows smoothly curving in to join the main streams, saturated color, and an interesting hatching pattern on the nodes.

Nadieh writes on her decision to use a dedicated software: “The main reason was the fact that the final numbers could change (slightly) until just days before the publication, making it quite a chore to have to remake these if they were all crafted in Illustrator.
Furthermore, by programming the logic of these visuals, I could prepare 90% of the required effort a month before the deadline by using the numbers from the previous report. When I finally received the final numbers, it was only a matter of changing the underlying data, and some small tweaks to get these final visuals ready.”
Bank Earnings & Net Profit Sankey

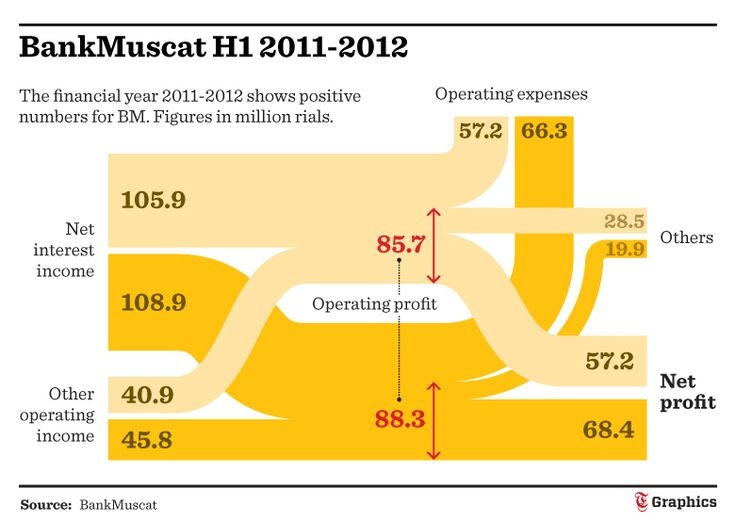
This Sankey diagram can be considered a distribution diagram as it shows how net interest income and other operating income of Bank Muscat in 2011/2012 are split into operating expenses and net profit.


(Source: Times of Oman Graphics)

Only at second sight I found out that this is actually a year-on-year comparison of the figures for H1/2011 and H1/2012. The light yellow flows are for the previous year, the dark orange flows for the other year, indicating an operating profit increase of 2.6 Mio Rials.

Landscapes of Climate Finance, I4CE

What is landscape of climate finance? A paper published December 2016 by I4CE tells us that “Landscapes of climate finance are comprehensive studies mapping financial flows dedicated to climate change action and the energy transition. Covering both end-investment and supporting financial flows from public and private stakeholders, [they] draw the picture of how the financial value chain links sources, intermediaries, project managers and the end investment.”

The paper by Hadrian Hainaut (I4CE), Andreas Barkman (EEA) and Ian Cochran (I4CE) titled ‘Landscapes of domestic climate finance in Europe: Supporting and improving climate and energy policies for a low-carbon, resilient economy’ features two interesting Sankey diagrams.

This is the ‘Landscape of Climate Finance in France 2014’:


Flows are in billion Euro. Sources and receiving sectors indicated with distinctive black boxes. The authors opted for strictly horizontal/vertical arrow routing. There are no individual quantities at each arrow, so the actual numbers can only be estimated from the arrow proportions.

This is the ‘National Climate Finance in Belgium 2013’:


Flows are in million Euros. Some muddle here at the exit of the top light blue box where the arrows overlap instead of showing the sum of roughly 2000 m€ spending. This coincides with three overemphasized arrow heads for the arrows leading to “Public Investments”, “Policy Incentives” and “Grants”. Arriving arrows at the box “Climate Mitigation” overlap and the Sankey diagram could benefit from clearing up here.

Not sure about the ESDC voting: “France: huit points, La Belgique: dix points” maybe 😉

I had reported on climate finance diagrams back in 2014 when the concept was first presented by Climate Policy Initaitive (CPI) but had since lost sight of them. I am happy to see that the idea is still alive and being taken up in a number of countries in Europe. Also good to see that the diagrams are not yet regulated by a standard and there is some “diversity” among these diagrams.

FIFA accounts – my version

In this post I had criticized a Sankey diagram depicting FIFA accounts published at BBC News. By drawing operating profits disproportionally they would overemphasize certain arrows.

Here is my version of the diagram, based on the values given in the article by Paul Sargeant (no warranty for the accuracy of these numbers). The orange arrow represents the operating profits, this time at the same scale.

Compare for yourself what impression the two diagrams create in you… and let me know by leaving a comment.

FIFA financial accounts Sankeyfied

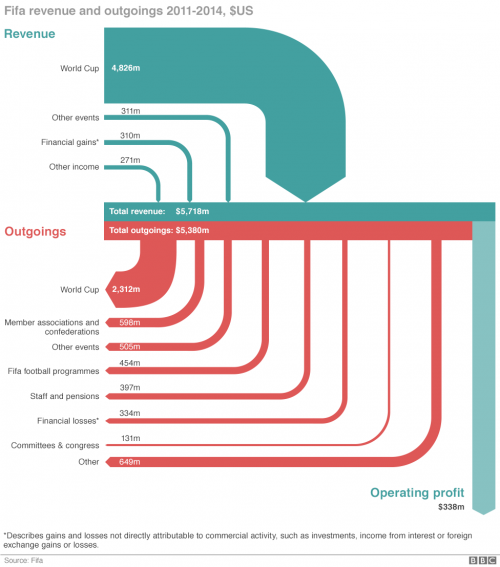
This diagram is by Salim Qurashi and Gerry Fletcher for the May 29, 2015 BBC News article ‘How Fifa makes and spends its money’ by Paul Sargeant.

BBC News via Coffee Spoons blog

The data is based on FIFA financial statements for 2011 through 2014. Flows in US$. The diagram depicts how “the Zurich-based multi-million-[dollar] organisation make its money and what does it spend it on?”.

This is only “sort of a Sankey diagram” as Brendan Barry “the man behind Coffee Spoons” notes. The light blue arrow for “operating profits” represents the balance difference between turquoise incoming and red outgoing flows. The infographic authors chose to set the arrows apart, which make it difficult to verify if arrow widths are to scale.

For the expert eye, some observations:

(1) Why has the sort order for incoming and outgoing flows been reversed? Imagine the red outgoing flow for “World Cup” (2,312m) being located at the right side thus becoming the longest arrow with a stronger emphasis…

(2) Not all flows are to scale: Compare the width of the light blue arrow for “operating profits” (338m) with another flow in the 300m-range such as “Financial Losses” (331m). An unintended flaw?

4see model: economy data visualized

Back in May 2013 I had reported about the ‘4see model’ developed by ARUP. The model is used to visualize certain data characterizing an economy, such as value streams, jobs or energy.

Browsing for new Sankey diagrams I came across 4see again, this time in an INSEAD Faculty & Research Working Paper titled ‘The 4see Framework: Characterizing an Economy by its Socio-economic and Energy Activities’ by Roberts et.al. (2013).

The model is explained in detail and the report features a number of beautiful diagrams. Here is one of them:

I chose to present this one on financial flows over the others (on transport, energy, employment), since it has some very distinct features.

In the core of the diagram is the balance of payments. The lower part of the diagram (within the frame) has trade flows (i.e. imports to the UK on the left side, exports from the UK on the right side). Interestingly, since this is meant to depict monetary flows, the direction of the arrows is inverted: goods-receiving countries have liabilities, so the flow is from right to-left (upstream). Same holds true for the UK that has to pay for its imports.

The elements in the dotted line rectangles and the linking flows are non-trade items (i.e. the financial system), some of the within the UK, others foreign. Make sure to read the description below figure 8 on page 16 of the report if you want to learn more.

Data is for the year 2010. The key below the diagram shows the default width of a stream representing ‘£100b[2010]/y’, which I read as ‘100 billion British Pounds normalized to base year 2010 per year’. No actual numbers given for each flow, but the different types of monetary flows in relation to each other and their rough dimensions permit to interpret the diagram.

My favourite Sankey diagram in 2015, so far.

Wikibudgets: Free Sankey Builder Web App

Steve from wikibudgets.org posted a comment calling attention to a new free web app they have launched on their website.

This is a straight-forward drawing tool for simple left-to-right distribution diagrams. On the website just pick a node (called “budget” there) and an arrow (called “transfer”), add amount, choose color. The elements can be dragged freely in the browser window. Easy zooming with mouse wheel or double-click on an element. The ‘Save Image’ command from the browser’s context menu lets you store a PNG file.

The motto of wikibudgets.org is to “Visualise public budgets. Rationalise politics. Tackle Corruption. Eliminate waste. Fight bureaucracy.” The Sankey diagrams everyone can produce with this tool aim at visualizing financial transfers in US$.

According to the wikibudgets.org blog this is a first early release of the open source Sankey app for desktop UI. Touch friendly editing for mobile devices is under development.

Added to the list of Sankey software.