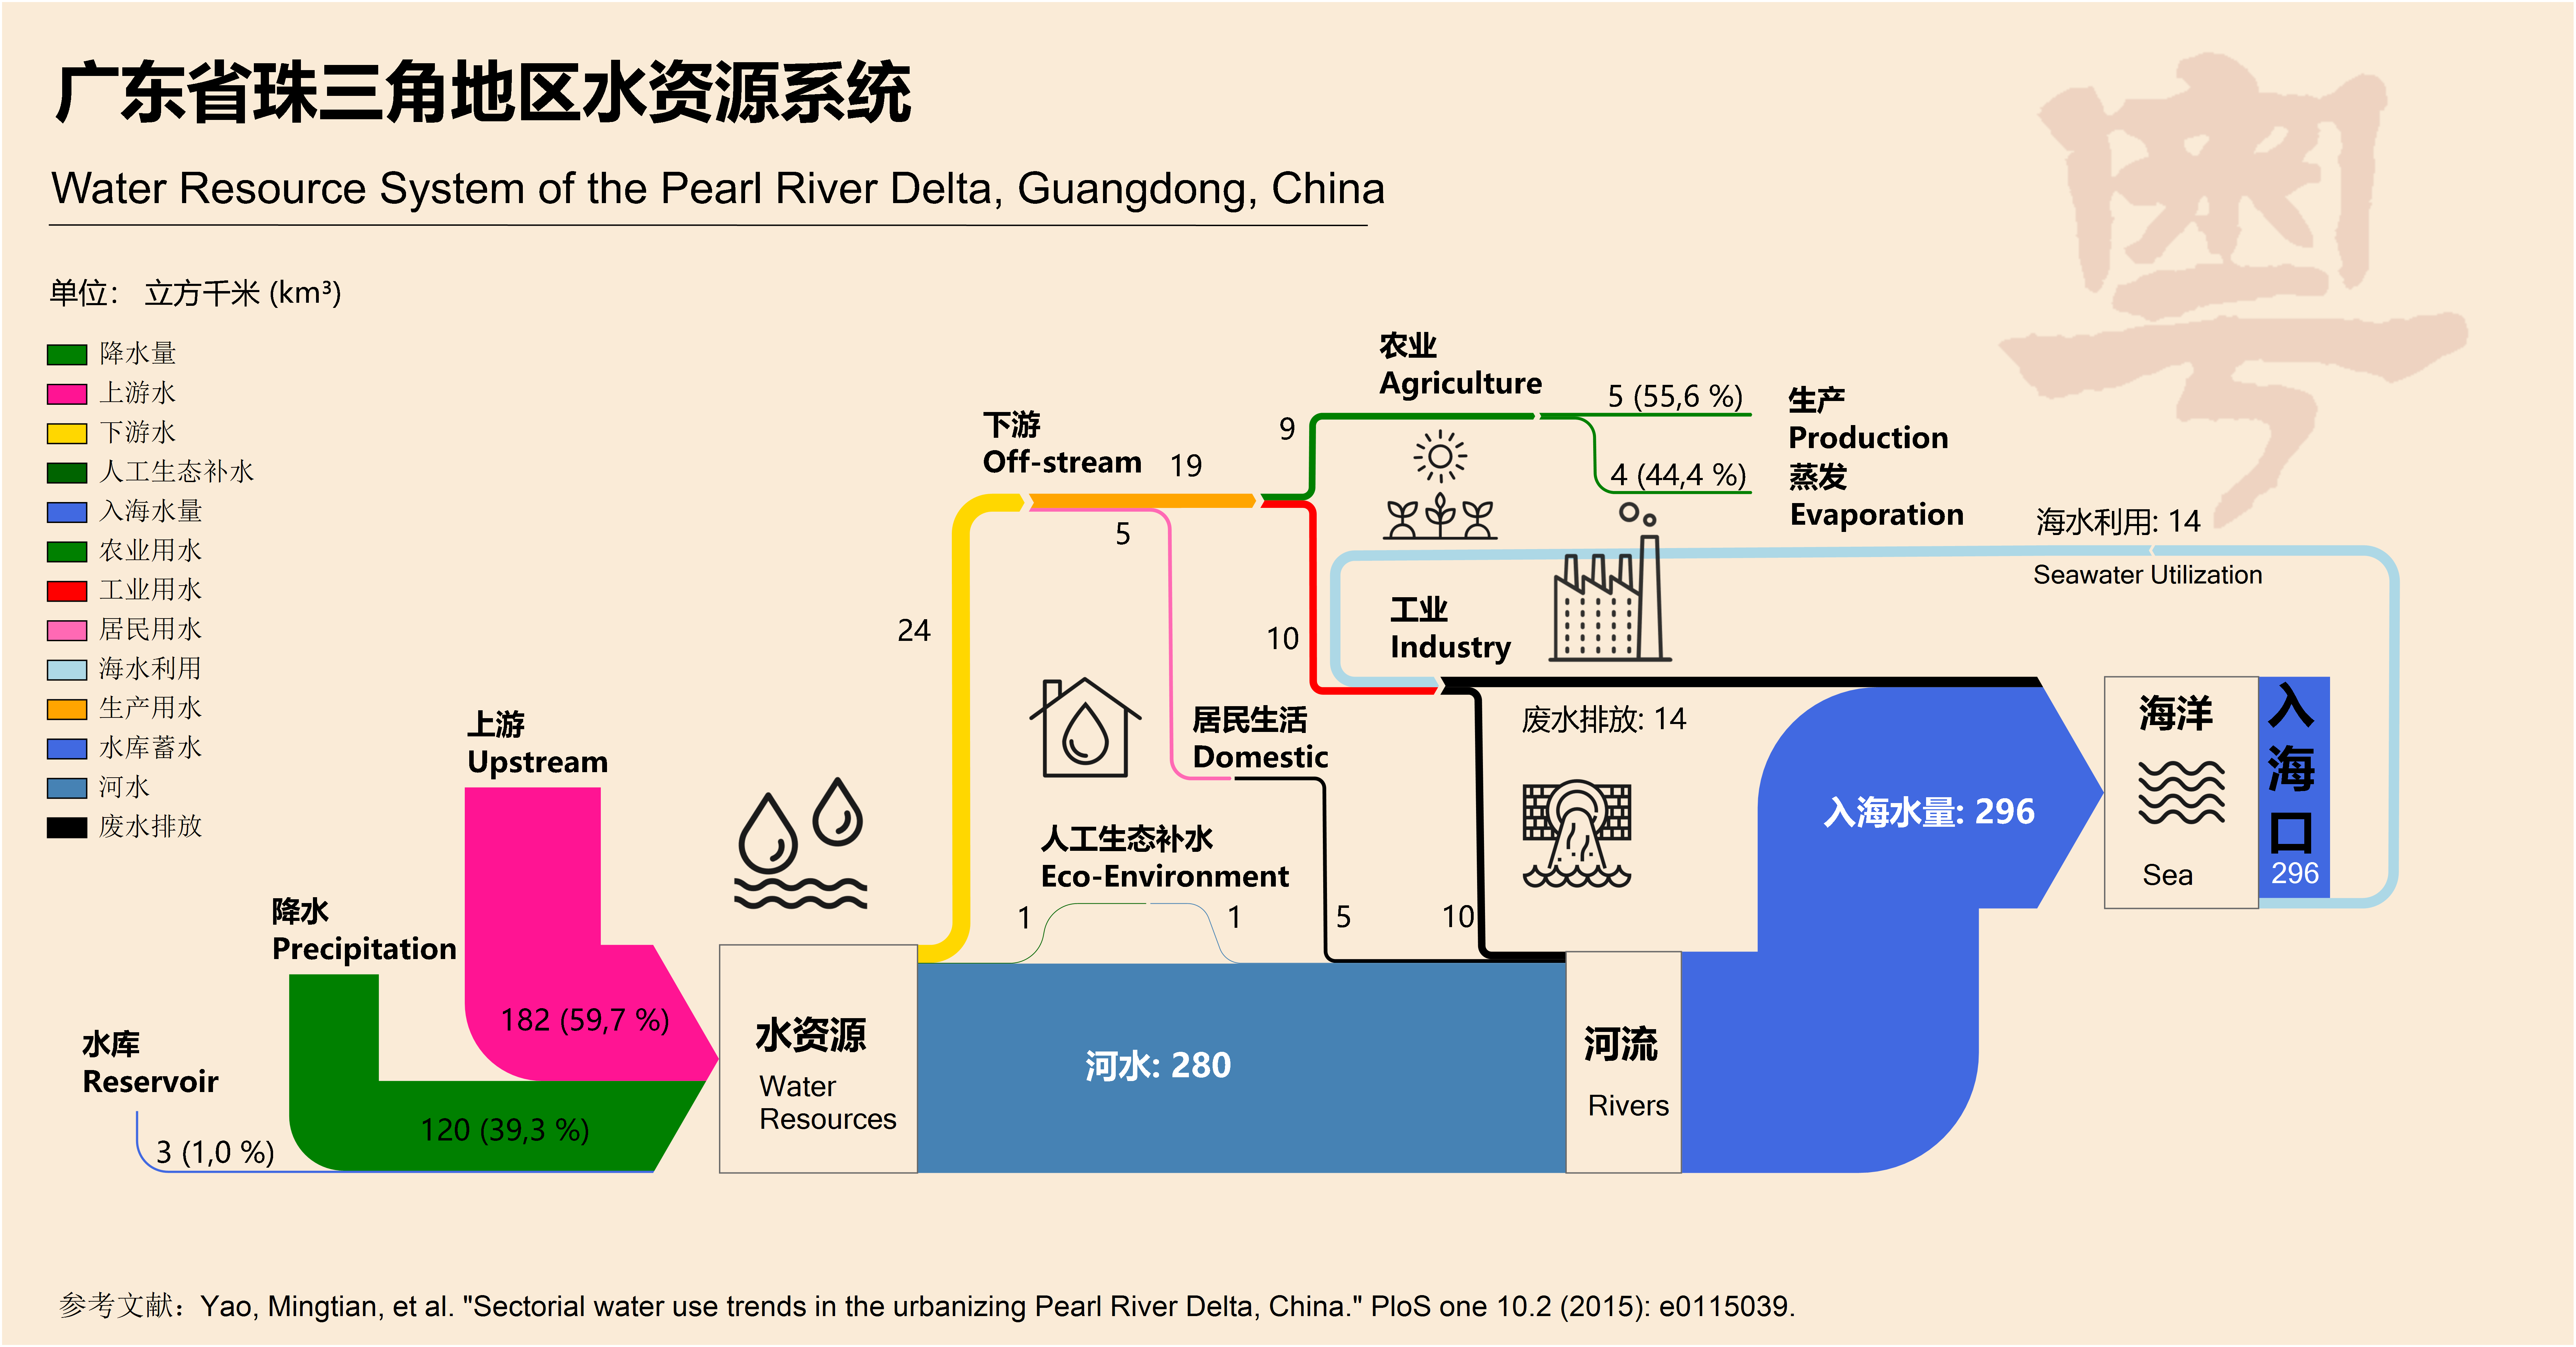
A follower of this blog sent me an e-mail with a Sankey diagram. I think it deserves to be presented here.
He writes [original e-mail, wording slightly modified by me]:
… I was inspired to do this by the Water Use in Qingdao post on your blog. When I discovered an article that had a schematic figure of the Pearl river water use system in my home province Guandong (广东省) I took on the task to create a nice Sankey diagram. I hope you like it. You are free to use it on your blog.
This is the original figure from an open access article Yao M, Werners SE, Hutjes RWA, Kabat P, Huang H (2015) Sectorial Water Use Trends in the Urbanizing Pearl River Delta, China. PLoS ONE 10(2):e0115039.doi:10.1371/journal.pone.0115039.
And here is the Sankey diagram that he created.
Flows are im cubic kilometres (km³) per year. Most of the water (280 km³), both from the upstream river and precipitation in the area, runs directly into the sea. A comparatively small part (24 km³) is taken for industry, agriculture and domestic use. Some water (14 km³) is also extracted from the sea for industry (cooling?).
Nicely done, somewhat colorful … I like! Thanks for sending this to me to share it with the public. A worthy farewell Sankey diagram…


