Tag: Germany

Energy Consumption Logistics Center

Here is another Sankey diagram out of Germany. Found this in a 2017 doctoral thesis titled ‘Wechselwirkungen und Auswirkungen von Planungsalternativen auf die Gesamtenergiebilanz und die CO2-Emissionen von Logistikzentren’ by Julia Freis, Lehrstuhl für Fördertechnik Materialfluss Logistik, Technical University Munich (TUM).

From what I understand using Google Translate this seems to be one of the energy scenarios (maintaining a 17°C temperature) for a logistics hub. Flows are in kWh per year.

Passive House School Building in Germany

Sankey diagrams from Germany (and in German) can be found abundantly on the web (try a Google image search for ‘Energiefluss Sankey Diagramm’). So, when lagging behind or short of time I sometimes pick one for a Friday afternoon post.

Here is one I found on the web page of ‘BINE Informationsdienst’, a resource portal for energy research and examples from practice. This Sankey diagram produced by Hochschule Magdeburg-Stendal.

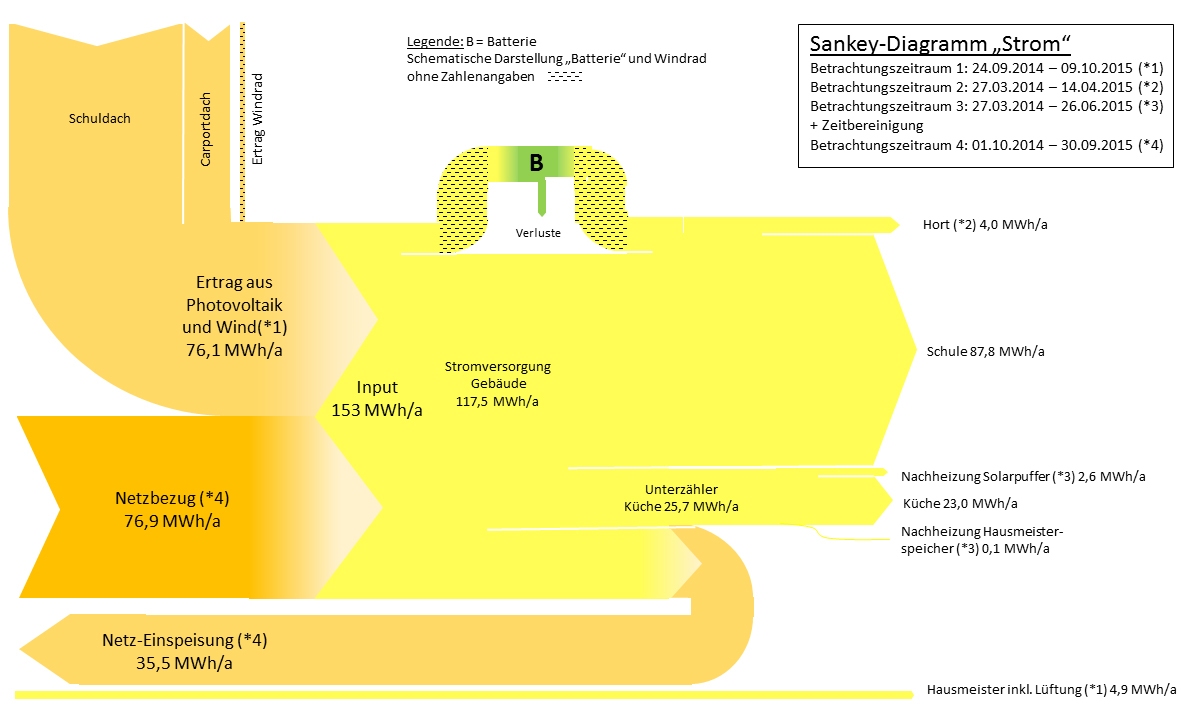
This energy flow Sankey diagram is for the first school in Germany built in 2014 according to Passivhaus standard in Halle. Flows are in MWh aggregated over a 12 month period. Energy harvested from solar panels on the school’s roof and a wind turbine were 76.1 MWh, with energy from grid amounting to 76.9 MWh. However, 35.5 MWh could be fed back to the grid (Netz-Einspeisung).

Non-Ferrous Metal Waste Paths

Another spectacular Sankey diagram from the final report of the project “Resource conservation through material flow-oriented secondary raw materials management” published by German Environment Protection Agency (Umweltbundesamt, UBA). This one is on non-ferrous metals in waste and recycling paths Germany. Flows are in mio. t for the year 2013.


I had presented another Sankey diagam from this report (on paper and cardboard streams) here on the blog back in January. You can access the full report here.

Paper and Cardboard Streams Germany 2013

German Environment Protection Agency (Umweltbundesamt, UBA) has published the final report of its project “Resource conservation through material flow-oriented secondary raw materials management” (German: “Stoffstromorientierte Ermittlung des Beitrags der Sekundärrohstoffwirtschaft zur Schonung von Primärrohstoffen und Steigerung der Ressourcenproduktivität”).

The study had been commissioned to three research institutes that were tasked to “analyse the Federal Statistical Office’s waste statistics … and carry out detailed investigations for 30 materials with focus on determining the recovery routes of these secondary raw material quantities and their derived substitution potentials.”

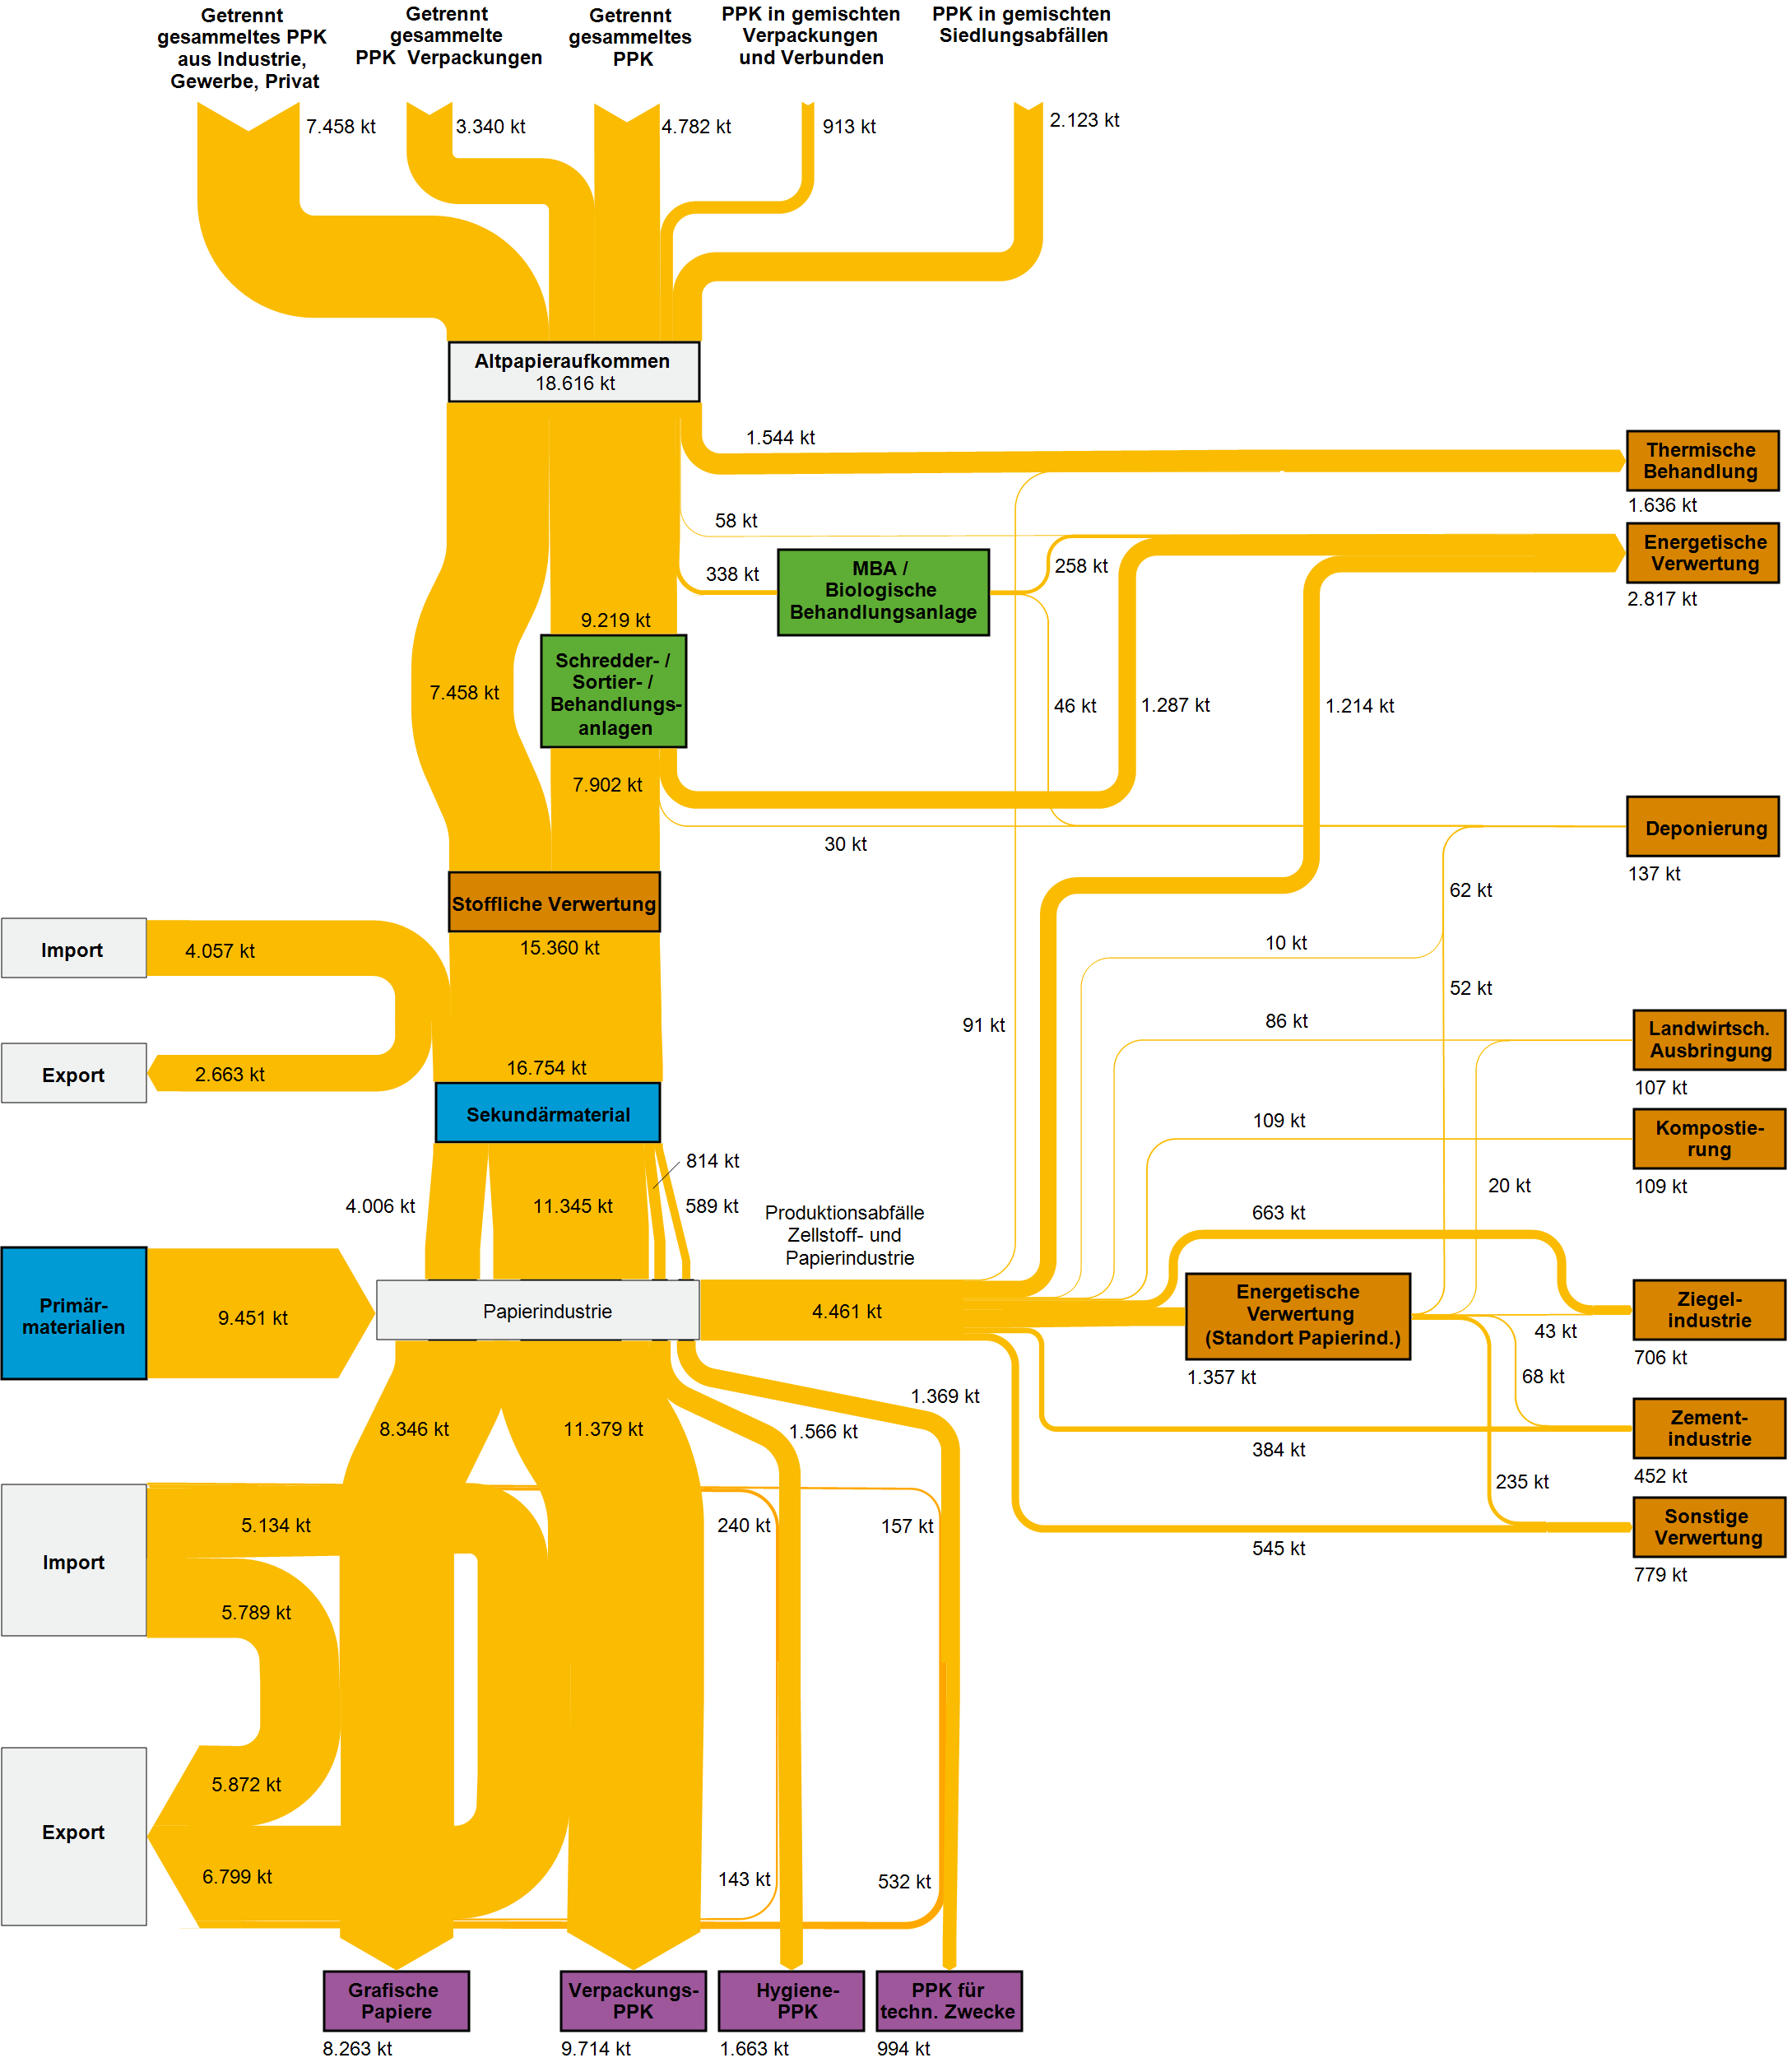
The report is gold for Sankey diagram aficionados: For all of the thirty materials analysed we can find Sankey diagrams depicting the streams through the economy and different recycling paths and secondary use options. Here is an example for paper and cardboard.

Flows are in kilo tonnes (kt) of material in 2013 in Germany. Inputs at the top are sources of paper fibres from waste collection. The general direction of flow is top-to-bottom with energetic use and reuse in other industries branching out to the right (brown boxes). Imports come in from the left and exports leave to the left again. Interesting to see, for example, that exports of graphical paper products almost exactly match the imports, while packaging paper exports (see stream to purple box “Verpackings PPK”) are slightly higher.

Beautifully crafted Sankey diagrams. A pity this isn’t available in English, but for those who love these self-speaking diagrams, here is the link to access the full report. Enjoy!

Energy Flows Germany 2018

Energy consumption in Germany is tracked by AG Energiebilanzen (Working Group on Energy Inventories) and a Sankey diagram is published annually. This is the latest one for 2018 featured on their website.

And again, it leaves me disappointed… Why does such a prestigious group as AGEB, that has been in the business of producing energy inventories since 1990 and energy flow diagrams at least since 2013, if not longer, produce Sankey diagrams that are not to scale?

Energy Transition in Germany, Study

A great number of Sankey diagrams are coming out of Germany, don’t know why that is…

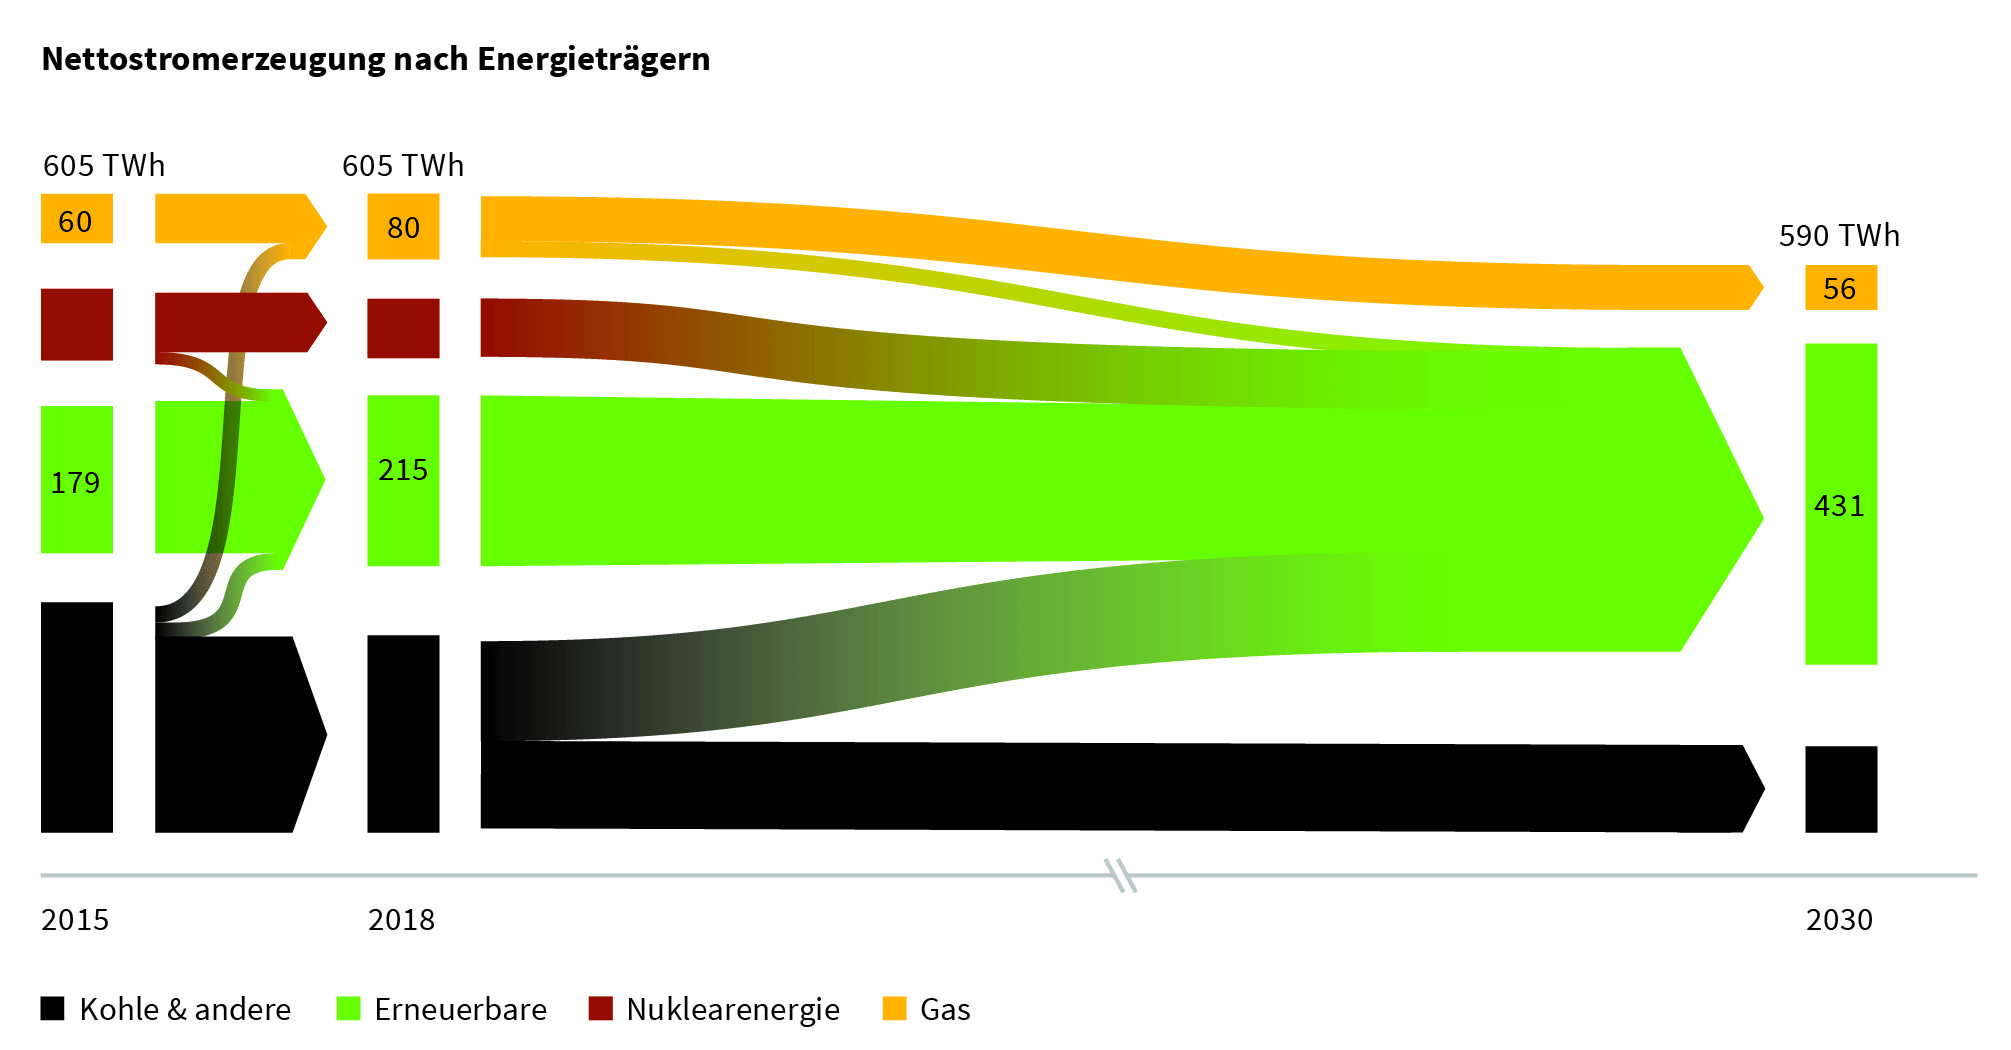
This one is from a study on the (stalling) progress of the ‘energy transition’ (some prefer to call it ‘energy turnaround’, ‘Energiewende’ in German). German Energy Agency (dena) and University of Cologne (EWI institute) have published an intermediate progress report. On climate change, Angel Merkel’s coalition has set the ambitious goal of reducing Germany’s greenhouse gas (GHG) emissions to 55% of the 1990 emission levels by 2030. One pillar of the energy turnaround is the increased use of renewable energy sources.

The study (PDF here, in German) contains a number of Sankey diagrams like this one:


The overall energy consumption of 605 TWh/year in 2015 hasn’t been reduced until 2018, but there is already a noticeable shift away from coal (black streams) and an increase in renewables. On the path to 2030 nuclear energy is to phased out completely and coal an gas are to be reduced significantly in favor of renewables with the overall consumption down to 590 TWh/year, mainly by means of energy efficiency measures.

Stuttgart City Energy Flows

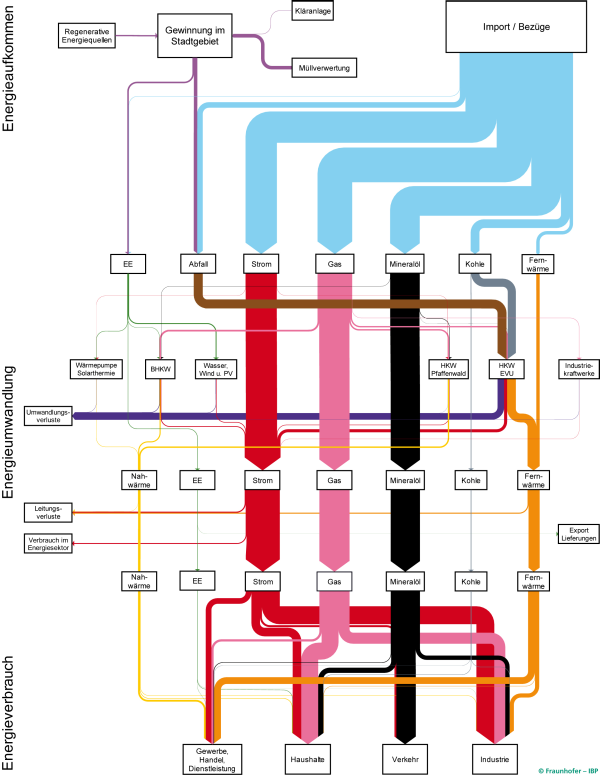
The energy balance of the German city of Stuttgart has been mapped as a Sankey diagram.

This was part of the project ‘SEE Stuttgart’ (City with Energy Efficiency / “Stadt mit Energie-Effizienz”) and has been developed by Fraunhofer IBP research institute.

A vertical layout was chosen. Absolute energy flow quantities are not shown in this version of the diagram, but are available in the underlying study. In 2010 primary energy consumption in Stuttgart was 20.300 GWh.

The diagram is used to promote a better understanding of the consuming sectors in the city, and the types of energy used. The SEE project aims to reduce Stuttgart’s energy consumption by 20% in 10 years and to transition to non-fossil fuels.

Stuttgart has actually won a first prize in a competition for energy efficient cities in 2016. It is thus setting a benchmark for other German cities. The above Sankey diagram is featured in this promotional video (in German) [at 2:36] and also briefly in this video (in German) [at 0:48] by IBP Fraunhofer.

A high resolution version of the Sankey diagram can be found here.

P2G: better done at home or offshore?

Great find by a follower of this blog who send me a link to this report in German available on the website of the German EPA (‘Umweltbundesamt’). The title translates as ‘Climate protection and regeneratively generated chemical energy carriers – infrastructure and system adaptation for the supply of regenerative chemical fuels from domestic and foreign regenerative energies’.

The report contains Sankey diagrams on 40 pages (!) like the two shown below. All of them are structured the same way with a vertical layout: a certain amount of energy available at production site, losses branching out to the right, and useful energy available on site shown as the remaining arrow at the bottom (colored in green).

From the management summary in English we learn that “this project aims at gaining first insights into the potential of renewable chemical fuels from renewable energy sources both domestic and abroad as well as the associated transport requirements. (…) [P]otentials and transport infrastructure for using renewable energy to provide storable energy carriers were analysed, being followed by a systematic comparison of the import routes of renewable gases, namely hydrogen (eH2) and methane (eCH4)”.

The assumption is that there are countries (e.g. Norway) that may have wind energy in excess, and regions (e.g. Turkey, Spain) where there is abundant potential for solar energy (PV). This electricity could be used for methanisation (power-to-gas, P2G). Gas from renewable energy could be stored in the German gas grid. The Sankey diagrams then show power-to-gas transformation on site and transporting the gas through pipelines to Germany, compared to the scenario of transporting electricity on the grid (with the associated losses) and to produce methane in Germany.

‘Klimaschutz und regenerativ erzeugte chemische Energieträger – Infrastruktur und Systemanpassung zur Versorgung mit regenerativen chemischen Energieträgern aus in- und ausländischen regenerativen Energien’ by Stefan Schütz of DBI Gas- und Umwelttechnik, Leipzig and Philipp Härtel of Fraunhofer-Institut für Windenergie und Energiesystemtechnik, Kassel. Report published Aug 2016 by German EPA (Umweltbundesamt, UBA). Download full report PDF here.

Thanks Axel from Germany for pointing me to this.