Category: General

Signing off…

Many of you have probably noticed that my posting had become somewhat scarce… not to say: had ceased. Well, the last months have brought some changes in my personal and professional life, so I have neglected posting Sankey diagrams.

Since starting this blog in February 2007 (almost 15 years ago), I did over 660 posts, or – in other words – showed you more than 660 Sankey diagrams. I did a last post yesterday, just for the sake of it, and with that will be signing off.

The good news is that I found someone who will take over from me: From December on, Riall will be posting here. And I hope that he finds some good Sankey diagrams to share with you.

sankey-diagrams.com – New Look

I had some downtime due to an unexpected issue with the blog, but everything is fine again now. Big shout-out to Chris who helped me with backup and recover.

The old theme didn’t work any more with the latest WordPress release, so I ended up with a new theme too. Still tweaking some of the font sizes and colors, but here we go.

After 12 years (since the first post in 2007) with the same look a refresh was probably justified.

Sankey GDPR choice

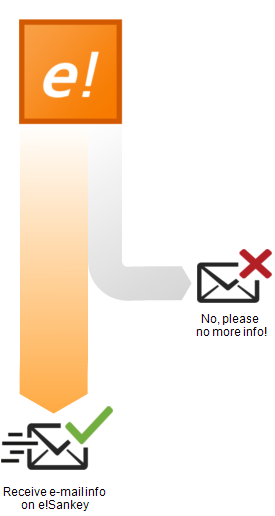
Among the literally hundreds of e-mails that flooded my inbox the last couple of days, urging me to consent to receiving e-mails in the future, one particularly caught my attention, since it used a Sankey diagram pic to convey the message:

My choice made clear in a simple visualization … Did I click the button? Yes I did!

Australian Energy Flows 2012/2013

After posting on Australian Metals Flows yesterday I realized I had never presented a Sankey diagram for energy flows in Australia.

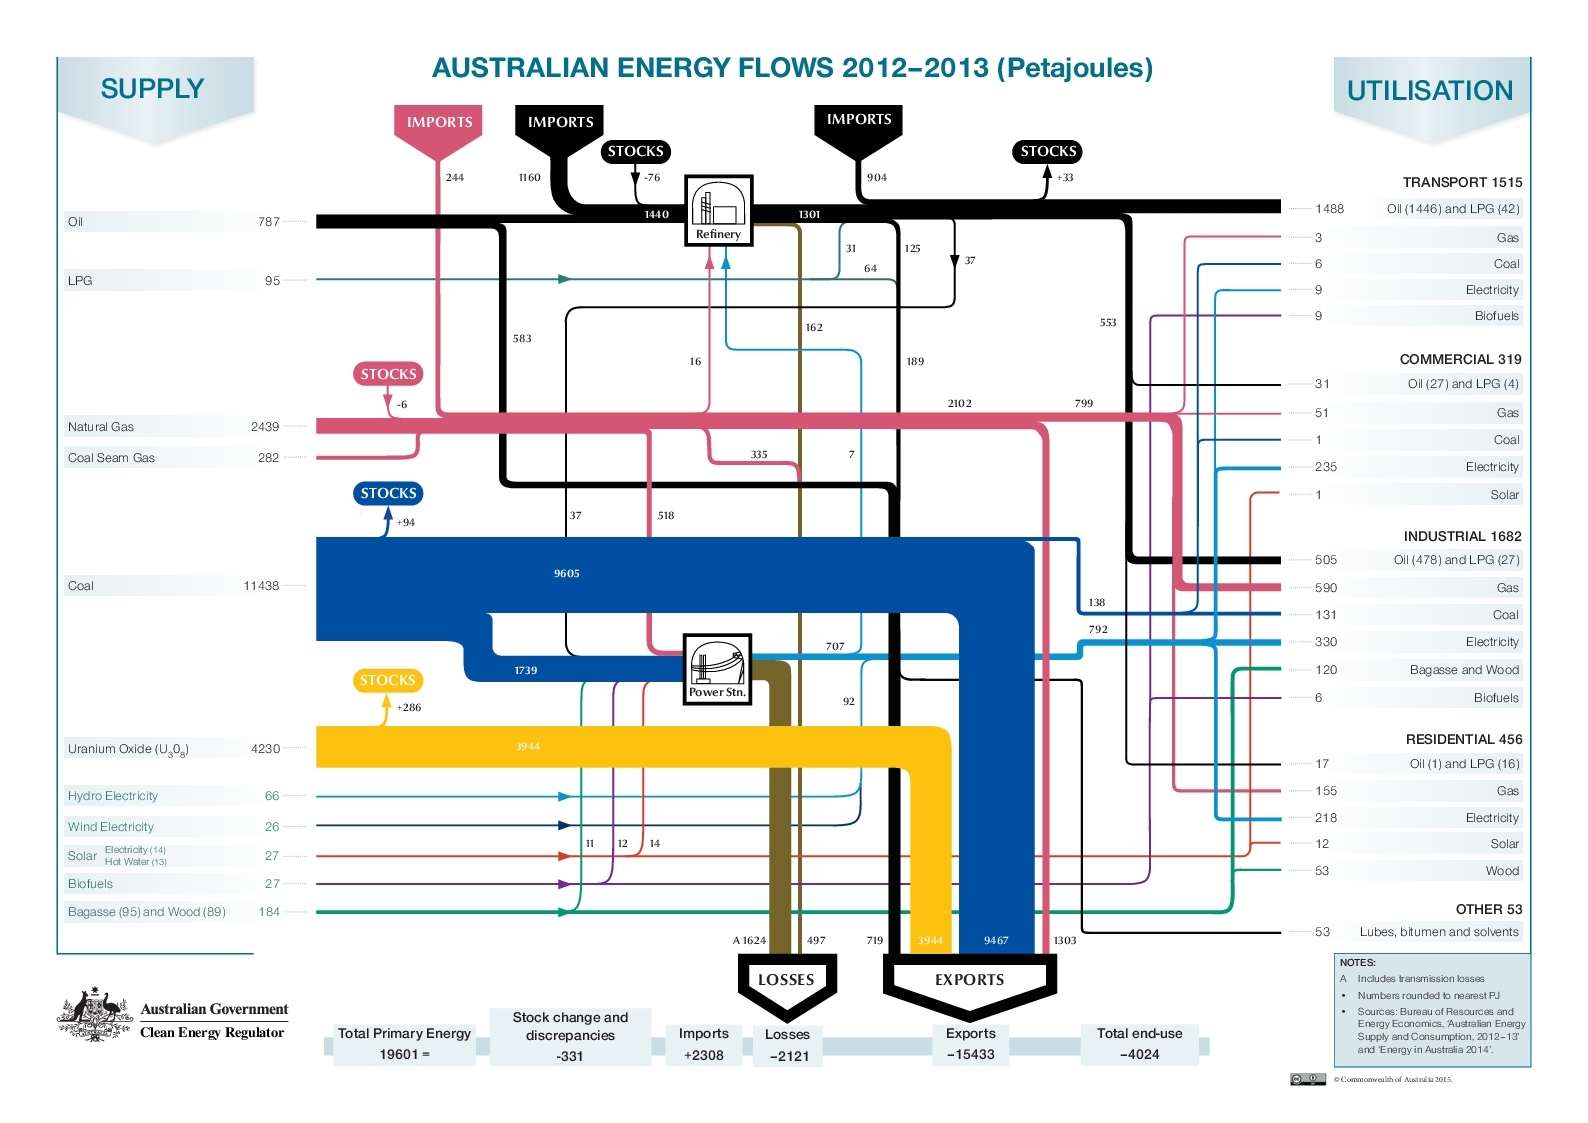
Well, here it is. From the Government of Australia, Clean Energy Regulator, Renewable Energy Target program website comes this beauty (CC-BY license Commonwealth of Australia):


One can really say that Australia is mainly exporting its energy. Flows in Petajoule (PJ) for the year 2012/13. Older energy flow diagrams available in the Australian Atlas of Minerals, Resources and Processing Centres here.

Australian Metal Flows

The Australasian Institute of Mining and Metallurgy (AusIMM) is an association of the minerals industry. In this AusIMM Bulletin article titled ‘From Waste to Wealth’ they talk about metal recovery and recycling in Australia.

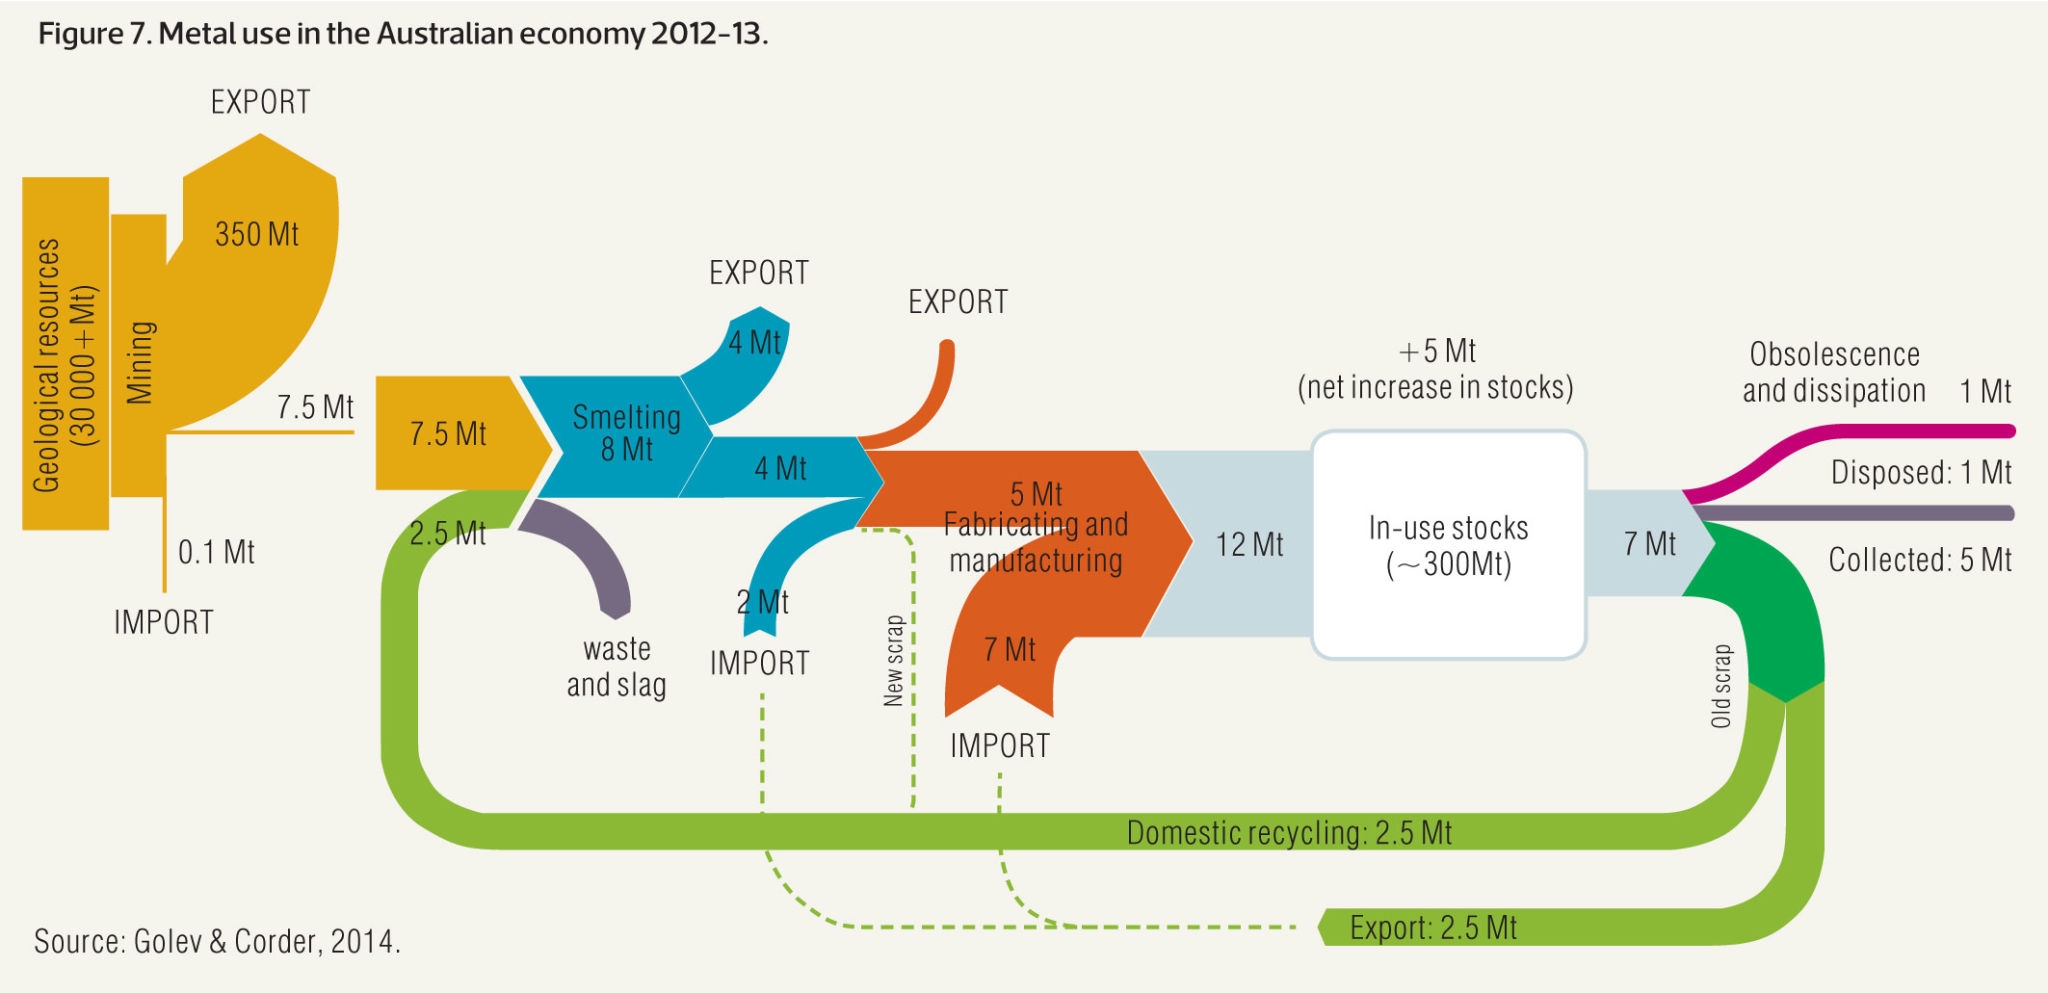
This Sankey diagram (actually two Sankey diagrams) from the article visualizes metal flows in Australia in 2012/2013 based on data from Golev & Corder (2014).

The smaller yellow diagram section on the left actually just shows mining activities in Australia and the fact that the largest portion of mining output (ores) are exported. Only 7.5 Mt are processed within Australia. This Sankey arrow is then blown up and corresponds to the yellow input stream into the second diagram [a similar solution to decouple diagrams with different scales was presented in yesterday’s post].

In the metal production process there are losses, and material is being exported and imported. The annual increase to the Australian ‘in use stocks’ (i.e. metals being used infrastructure, buildings and products) is 12 Mt, possible only thanks to 7 Mt metals imports. Some 7 Mt of metals are also released annually from ‘in use stocks’.

The dotted lines signal that there are possible routes, but either outside the scope of the Australian market or no reliable data is available (new scrap from the manufacturing step being fed back to the smelting).
2016 Wishes Sankey Diagram

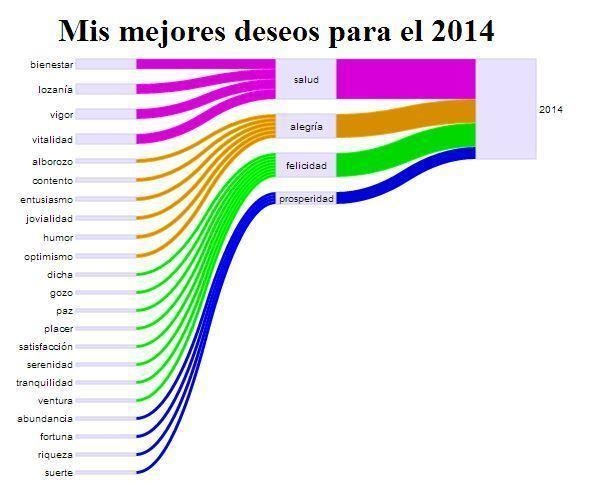
OK, this doesn’t claim to be scientific at all. Credits for this idea go to Mariluz Congosto who did such a New Year’s Wishes Sankey Diagram in Spanish two years ago.

This time I refrain from criticism of the Sankey diagram. I could say that there are no units given for the flow quanities. Also, weight of the contributions to the four categories will in most personal cases not be equal. Love must certainly have a much fatter arrow. For some, prosperity might have more importance. Are the categories weighted properly amongst each other? Are the colors chosen appropriately? 😉

Best wishes to all readers of the blog. Have a very happy new year 2016 full of health, happiness, luck and prosperity! For a recipe use the Sankey diagram above.

Original Sankey diagram for 2014 by Mariluz Congosto with whom I share an afición: