Tag: process technology

Sankey Diagram for Air Compressor

A comment from a reader pointed me to this Sankey diagram for energy flows in an air compressor system. It can be found as a sample on the web page of VHK Research Engineers. VHK uses Sankey diagrams to “get the message across”.


(Image copyright: European Union, author: VHK)

This is a rare example of a top-down oriented Sankey diagram. There are no absolute numbers, rather we see the 100% energy being turned into useful work, and off-heat, which could potentially be recovered.

Nice piece of art, and I invite Rene to comment on this…
Misc Sankey Diagrams Uncommented 25

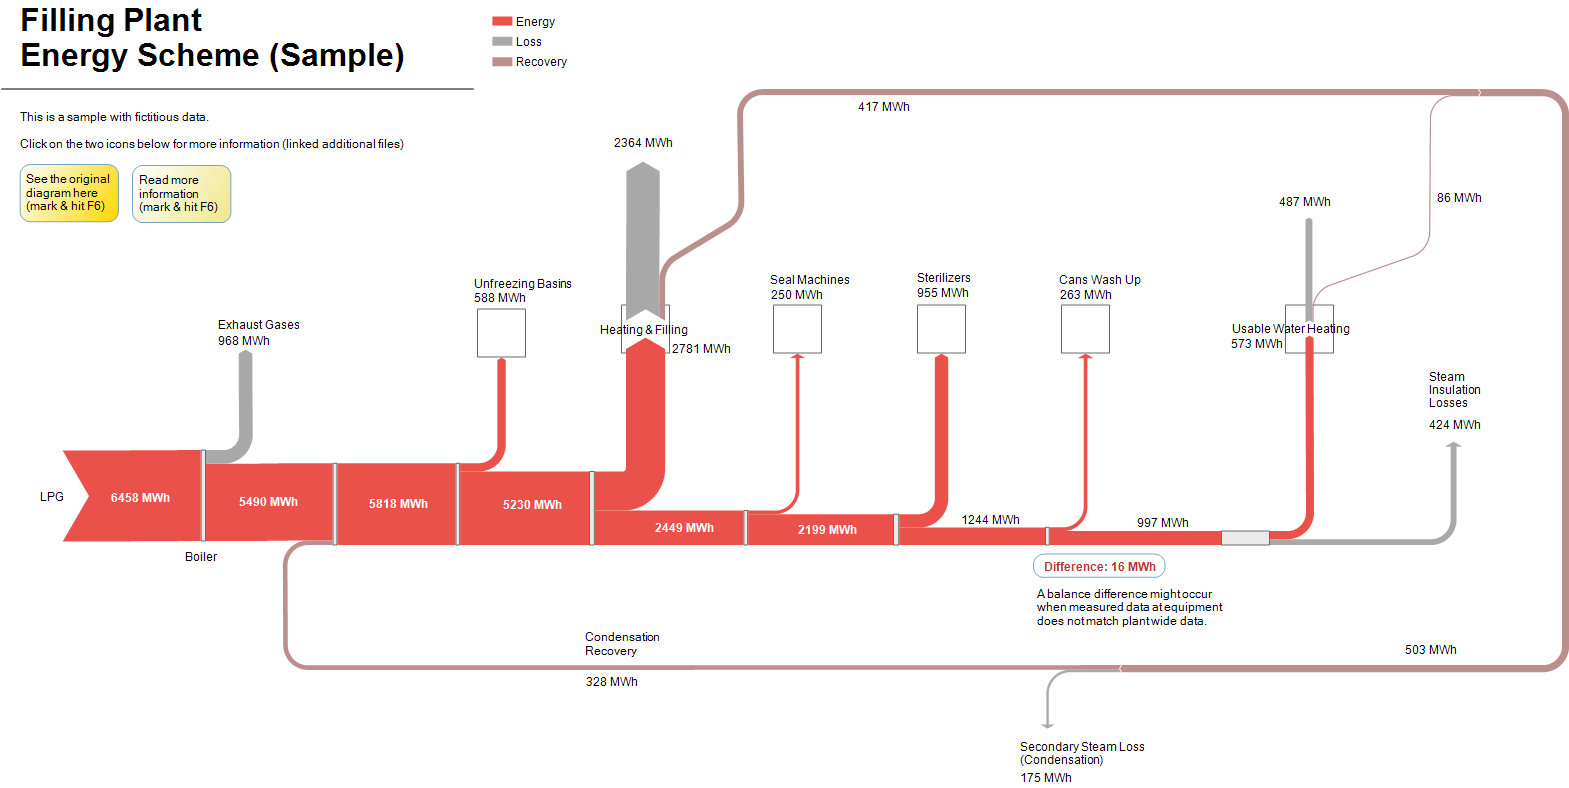
Just a quick Friday afternoon post in order not to let this week slip past without a post. This is a sample from the latest e!Sankey demo version.

The Sankey diagram represents energy flows in a canning plant with heat being distributed to the various steps of the process. Recovery of energy (red-brown arrow) from two of the steps.

Rapeseed Production

From the museum of Sankey diagrams, here is a black&white classic. This Sankey process diagram for rapeseed oil production is taken from the year 2002 dissertation ‘Simultane Öl- und Proteingewinnung bei Raps’ (Simultaneous oil and protein production from rapeseed) by Andreas Waesche, Berlin Technical University.


Flows are in kilograms per ton of rapeseed input. Black is the water fraction, dark gray is oil, and light gray is oil free dry matter. Rapeseed husks, filtered matter and liquid rejects branch out on arrows to the right. Extract from the T4 separation stage (‘Extrakt als Ruckfuhrung’) is fed back into the second node although this loop is not shown here.

WWTP Flowsheet

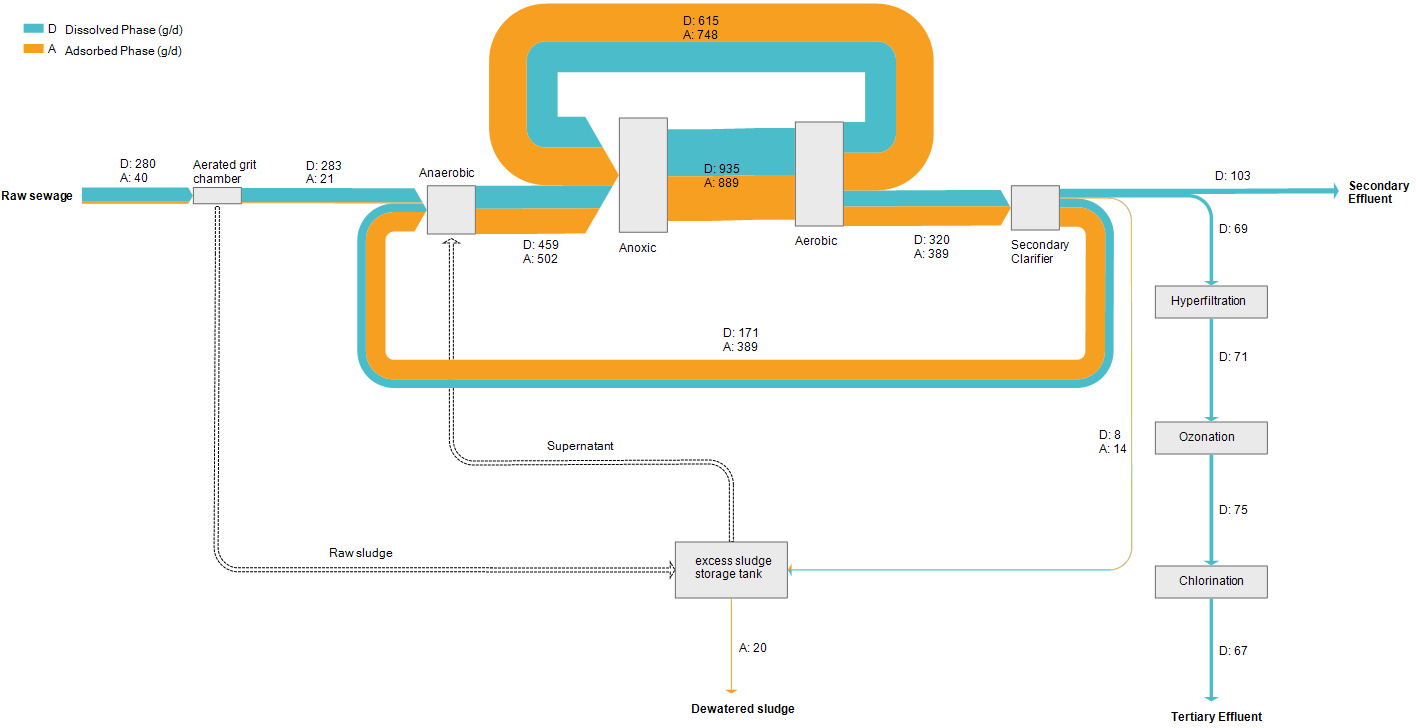
Another Sankey diagram from a waste water treatment plant (WWTP). This one shows concentrations (of organic matter?) in dissolved and adsorbed phases in grams per day. Actual volume streams are not represented.

Chemicals from Lignocellulosic Biomass

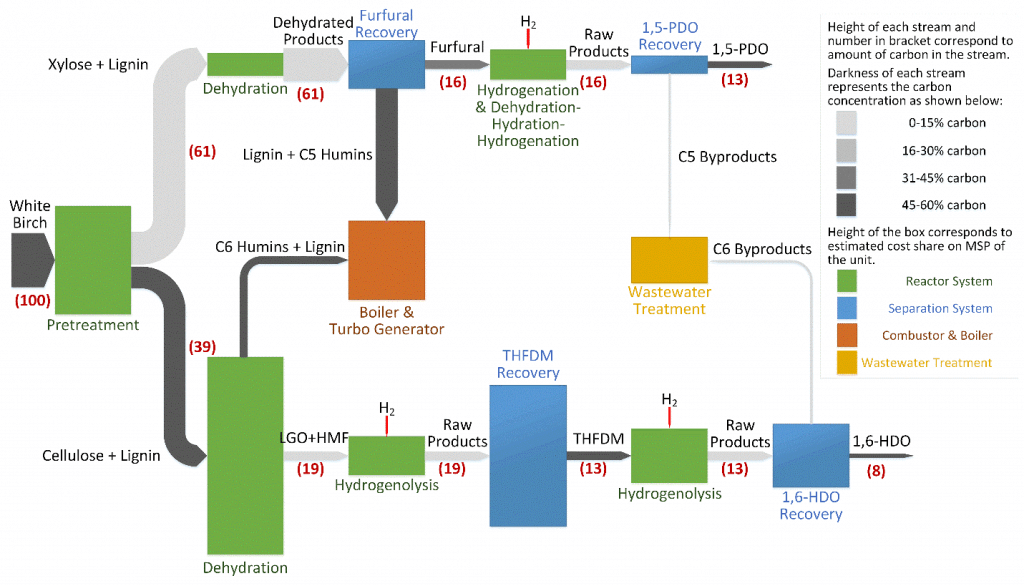
One of the research topics in the research group of Prof. Christos T. Maravelias at University of Wisconsin – Madison is ‘Renewable Chemicals from Lignocellulosic Biomass’. One line of research is into producing chemicals such as 1,4-butanediol (1,4-BDO), 1,5-pentanediol (1,5-PDO) and 1,6-hexanediol (1,6-HDO) from wood chips.

This process Sankey diagram is from the research description page of the Maravelias group.


The red numbers relate to the carbon content in the process (starting with 100% carbon molecules in the feedstock, white birch wood). The coloring of the Sankey arrows is used to signal carbon concentration. And the height of the process nodes shows the cost share of a unit in the process (no absolute cost, just relatively to each other). Interesting! Read more here.

Also see: TriVersa process

TriVersa biorefinery process

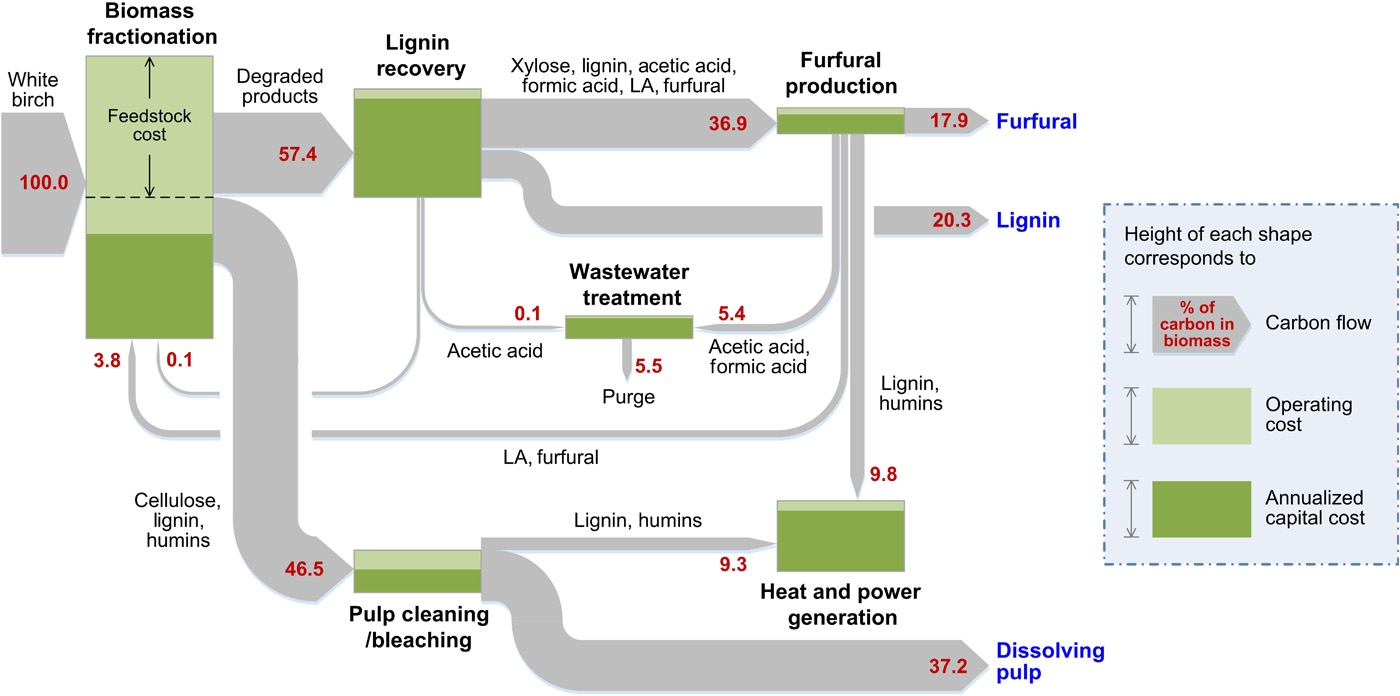
Javier Dufuor on the madrid+d Energía y Sostenibilidad blog reports about a novel lignocellulose biorefinery process developed by Prof. James A. Dumesic at the University of Wisconsin-Madison. This so-called TriVersa process can yield up to 80% of biomass from birch wood as marketable products.

The Sankey diagram for the TriVersa process shows carbon in biomass flows. Values are in percent, starting with the 100% C molecules in birch wood being used as feedstock.

An interesting detail about this Sankey diagram is that it additionally uses the process “nodes” or “boxes” to indicate operating cost and annualized capital cost. No numbers are given here, but the height of the process box indicates the overall cost (in a kind of stacked bar chart).

Ammonia production technologies compared

A comparison of different Ammonia production technologies is made in a post on ‘Comparative studies of ammonia production, combining renewable hydrogen with Haber-Bosch’ by Trevor Brown on the Ammonia Industry blog.

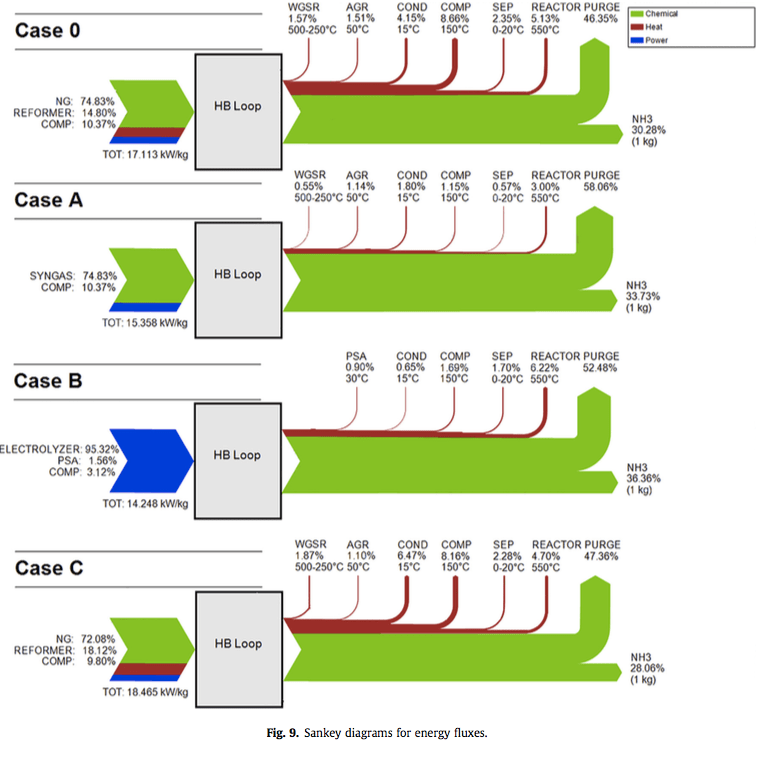
It also features this these Sankey diagrams from an Italian research study by Fratelli et.al.


(published under CC BY 4.0)

All diagrams relate to the production of 1 kg of ammonia (NH3). The authors in their “research examined three cases for renewable hydrogen production, including biomass gasification (Case A), electrolysis of water using solar or wind power (Case B), and biogas reforming (Case C), and compared these sustainable hydrogen sources against the traditional steam methane reformation of natural gas (Case 0)”.

Blue flows represent electrical energy, red flows are heat energy, including the losses (off-heat). Green flows show chemical energy embodied in the product and the feedstock.

For the original study check Fratelli et al: A system approach in energy evaluation of different renewable energies sources integration in ammonia production plants. In: Renewable Energy, Volume 99, December 2016, Pages 472-482.

Desalination by RO Process Retrofit, Sankey

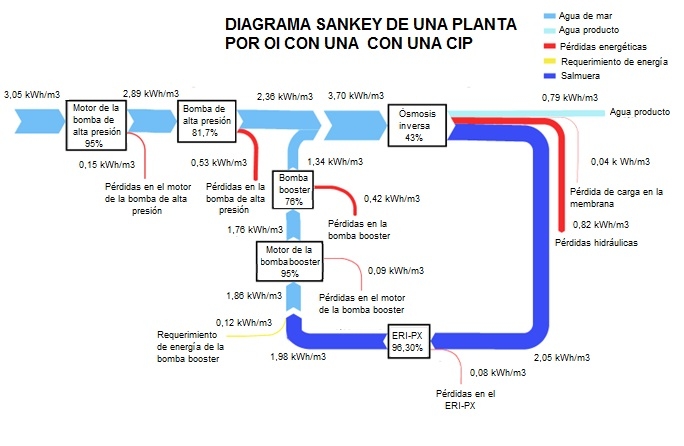
Removal of salt from seawater (desalination) is used to produce drinking water and water for irrigation in the Canary Islands, Spain. This is an energy intensive process.

The article ‘La importancia de los sistemas de recuperación de energía en la desalación de aguas en Canarias’ (The importance of energy recovery systems in water desalination in Canary Islands) by Baltasar Peñate Suarez and Sigrid Arenas (both of Departamento de Agua del Instituto Tecnológico de Canarias, ITC) on the IAGUA blog (in Spanish) describes how existing reverse osmosis (RO) salt removal systems with Francis turbines were retrofitted to be more energy efficient.

The two Sankey diagrams in the blog post visualize the energy flows before and after the retrofit. Energy consumption per cubic metre of water desalinated could be reduced from 3.65 kWh/m³ to 3.05 kWh/m³ by installing isobaric energy recovery devices and last generation membranes.

Check out the blog post to see both Sankey diagrams.