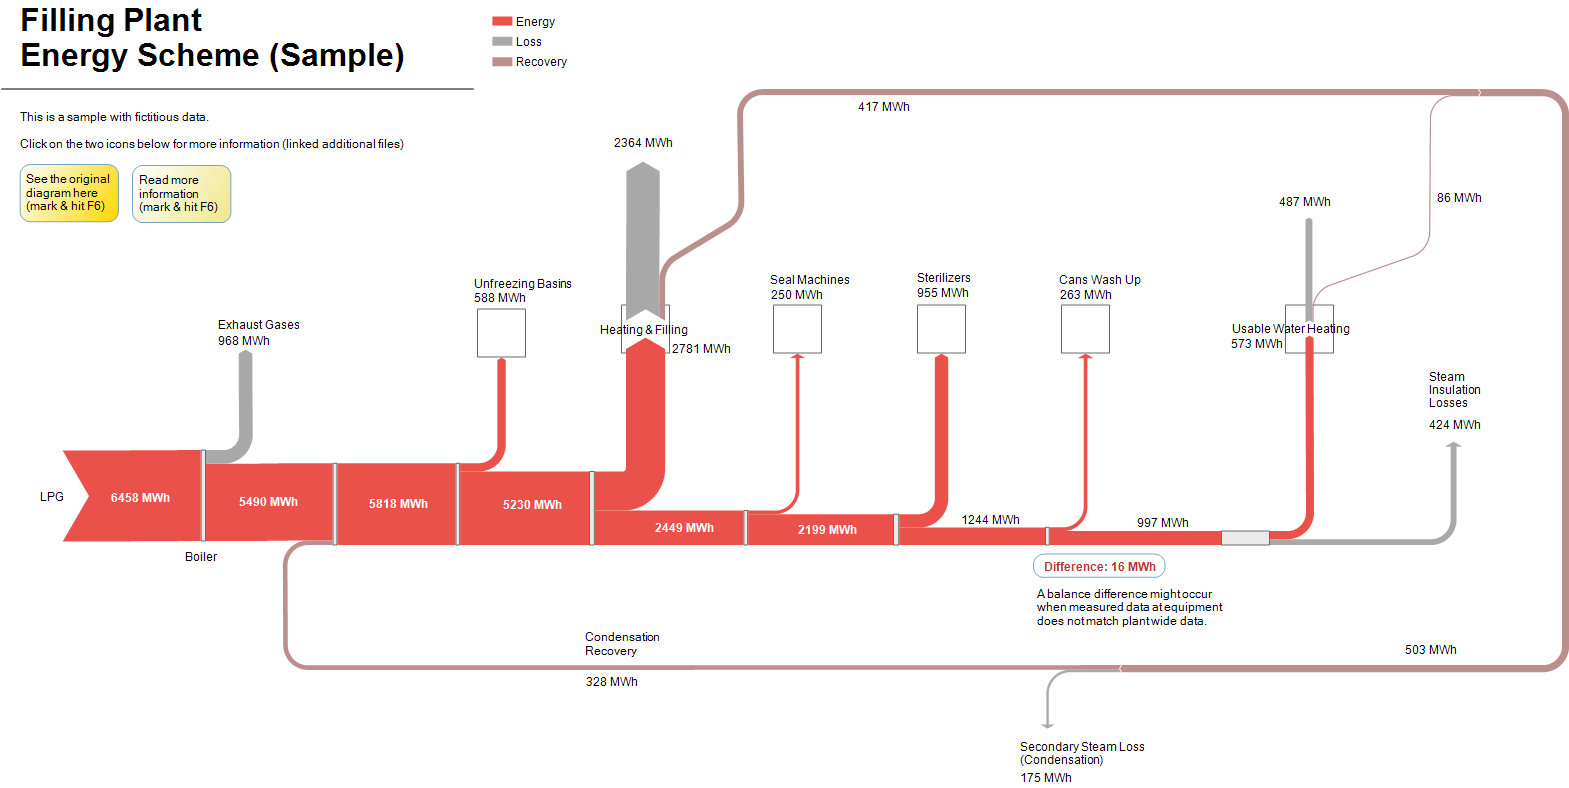
Just a quick Friday afternoon post in order not to let this week slip past without a post. This is a sample from the latest e!Sankey demo version.
The Sankey diagram represents energy flows in a canning plant with heat being distributed to the various steps of the process. Recovery of energy (red-brown arrow) from two of the steps.
