Tag: urban

New York Zero Waste Scenario 2030

Came across an interesting article by Tei Carpenter, ‘Waste Not, Want More: Zeroing In on Designing Waste’ in the Avery Review 33 (September 2018). It describes a transition to a zero waste scenario for New York in 2030.

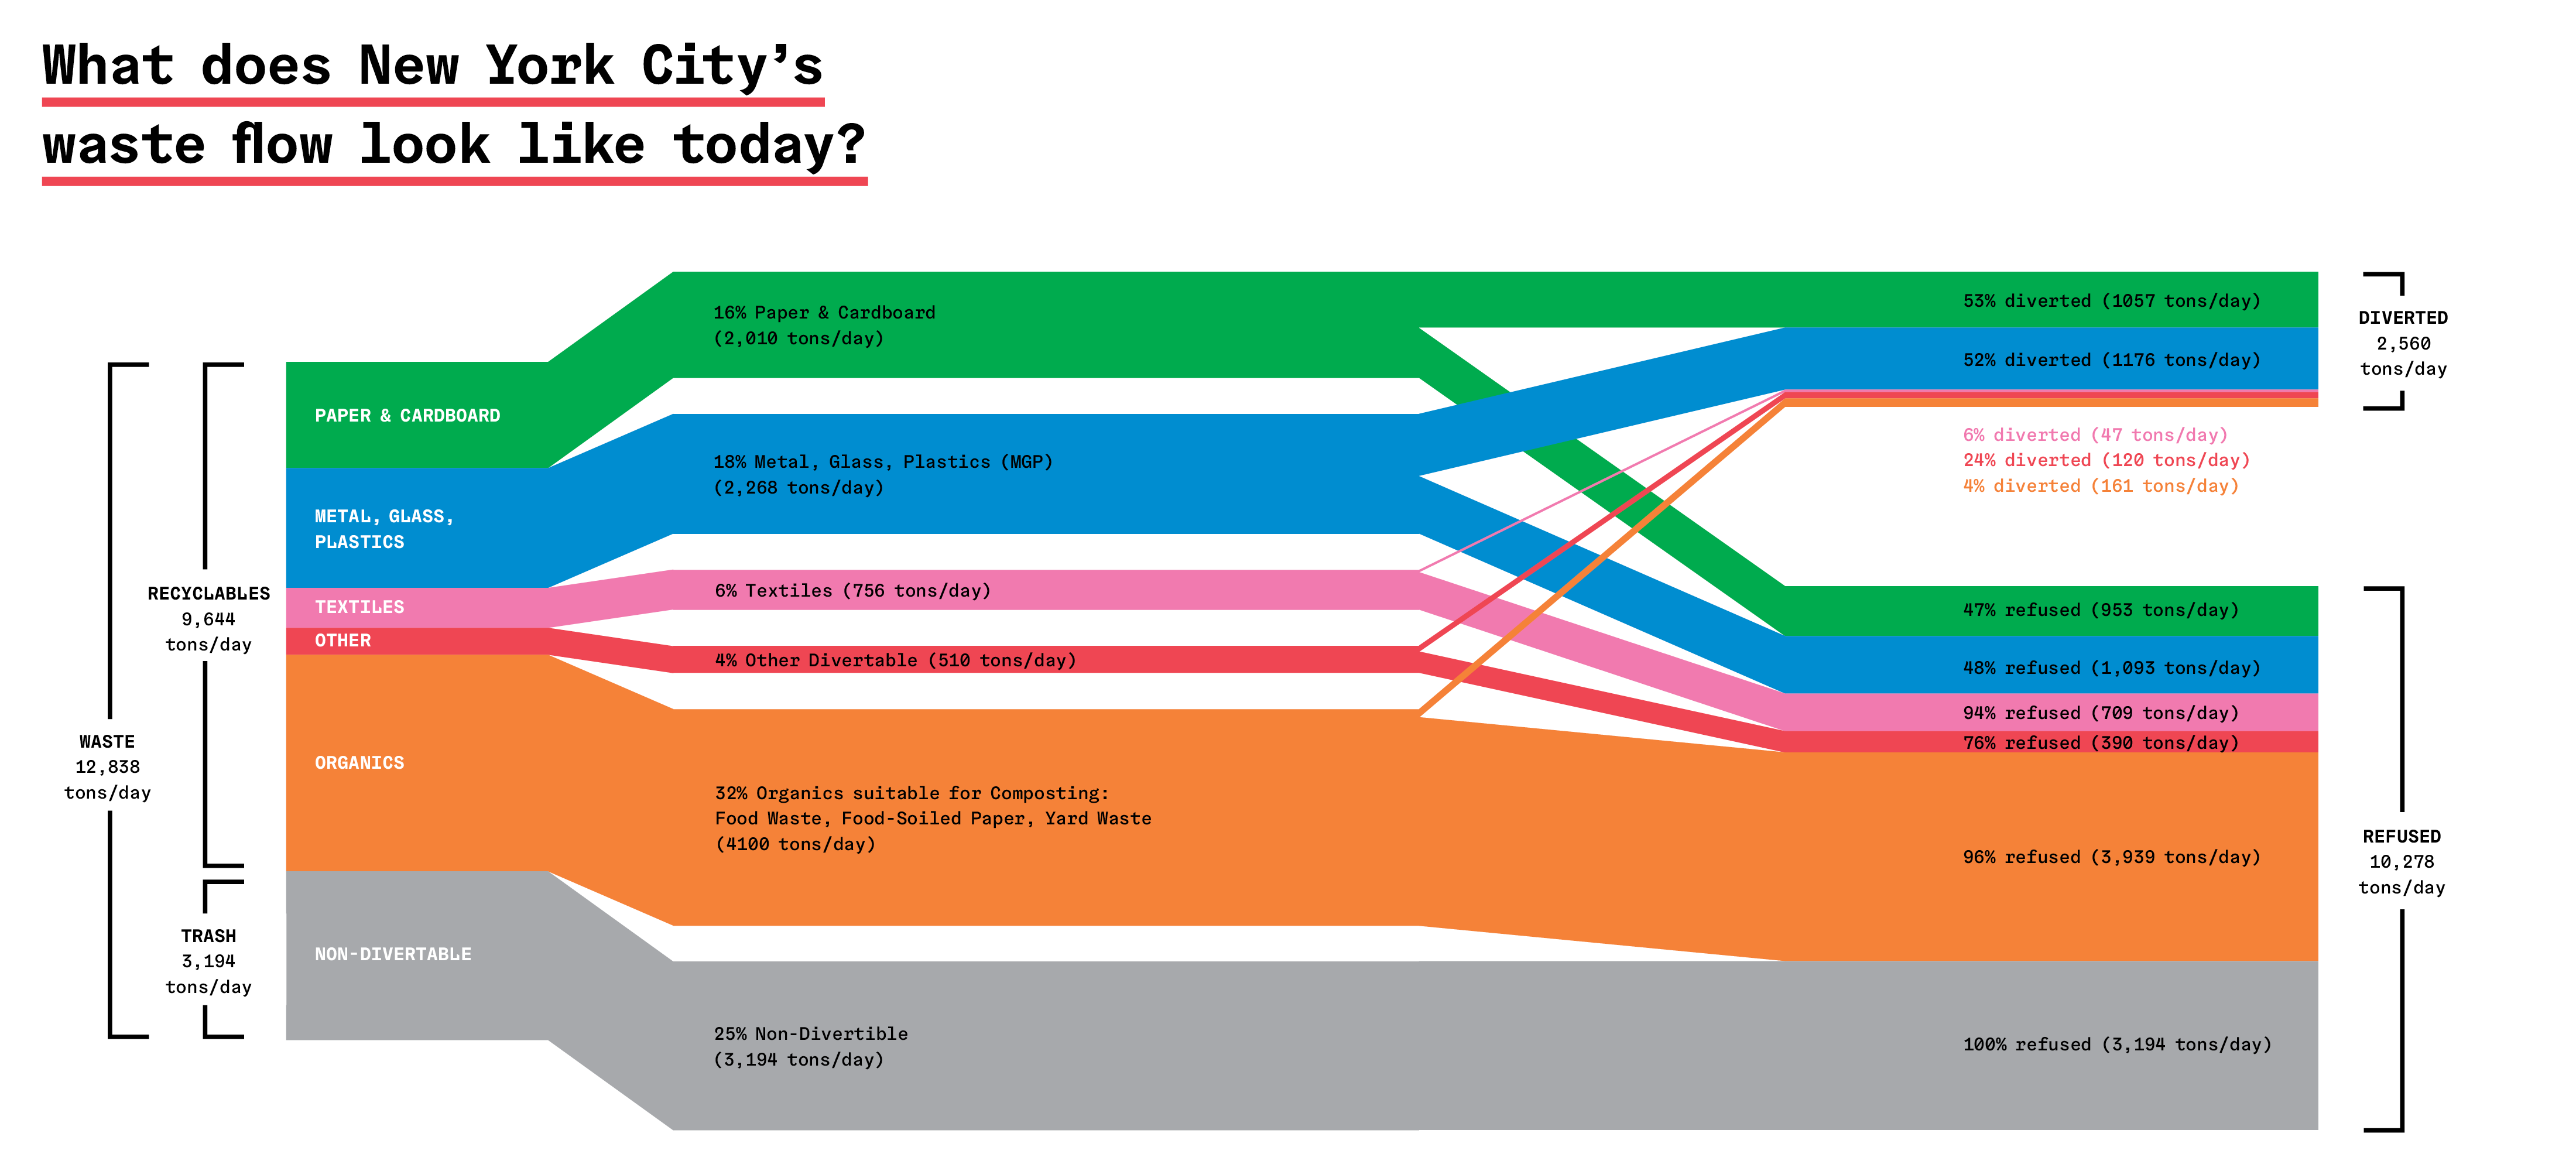
This is the Sankey diagram for the waste situation today (that is… 2018). An incredible 12,838 tonnes per year day. Of which 75% would theoretically be recyclable. Instead, 80% end up as refuse, while only 20% are “diverted”.


There is also a second Sankey diagram that shows how the city would handle its waste in 2030 with a zero waste strategy. Read the article at Avery Review or download as PDF.

Metabolic, Rotterdam Construction Flows

Dutch consulting firm Metabolic have posted a great article ‘Why data visualization is critical to driving sustainable change’ on their blog. It features several examples of Sankey diagrams and argues that good visualization is key to sustainability projects and communication.

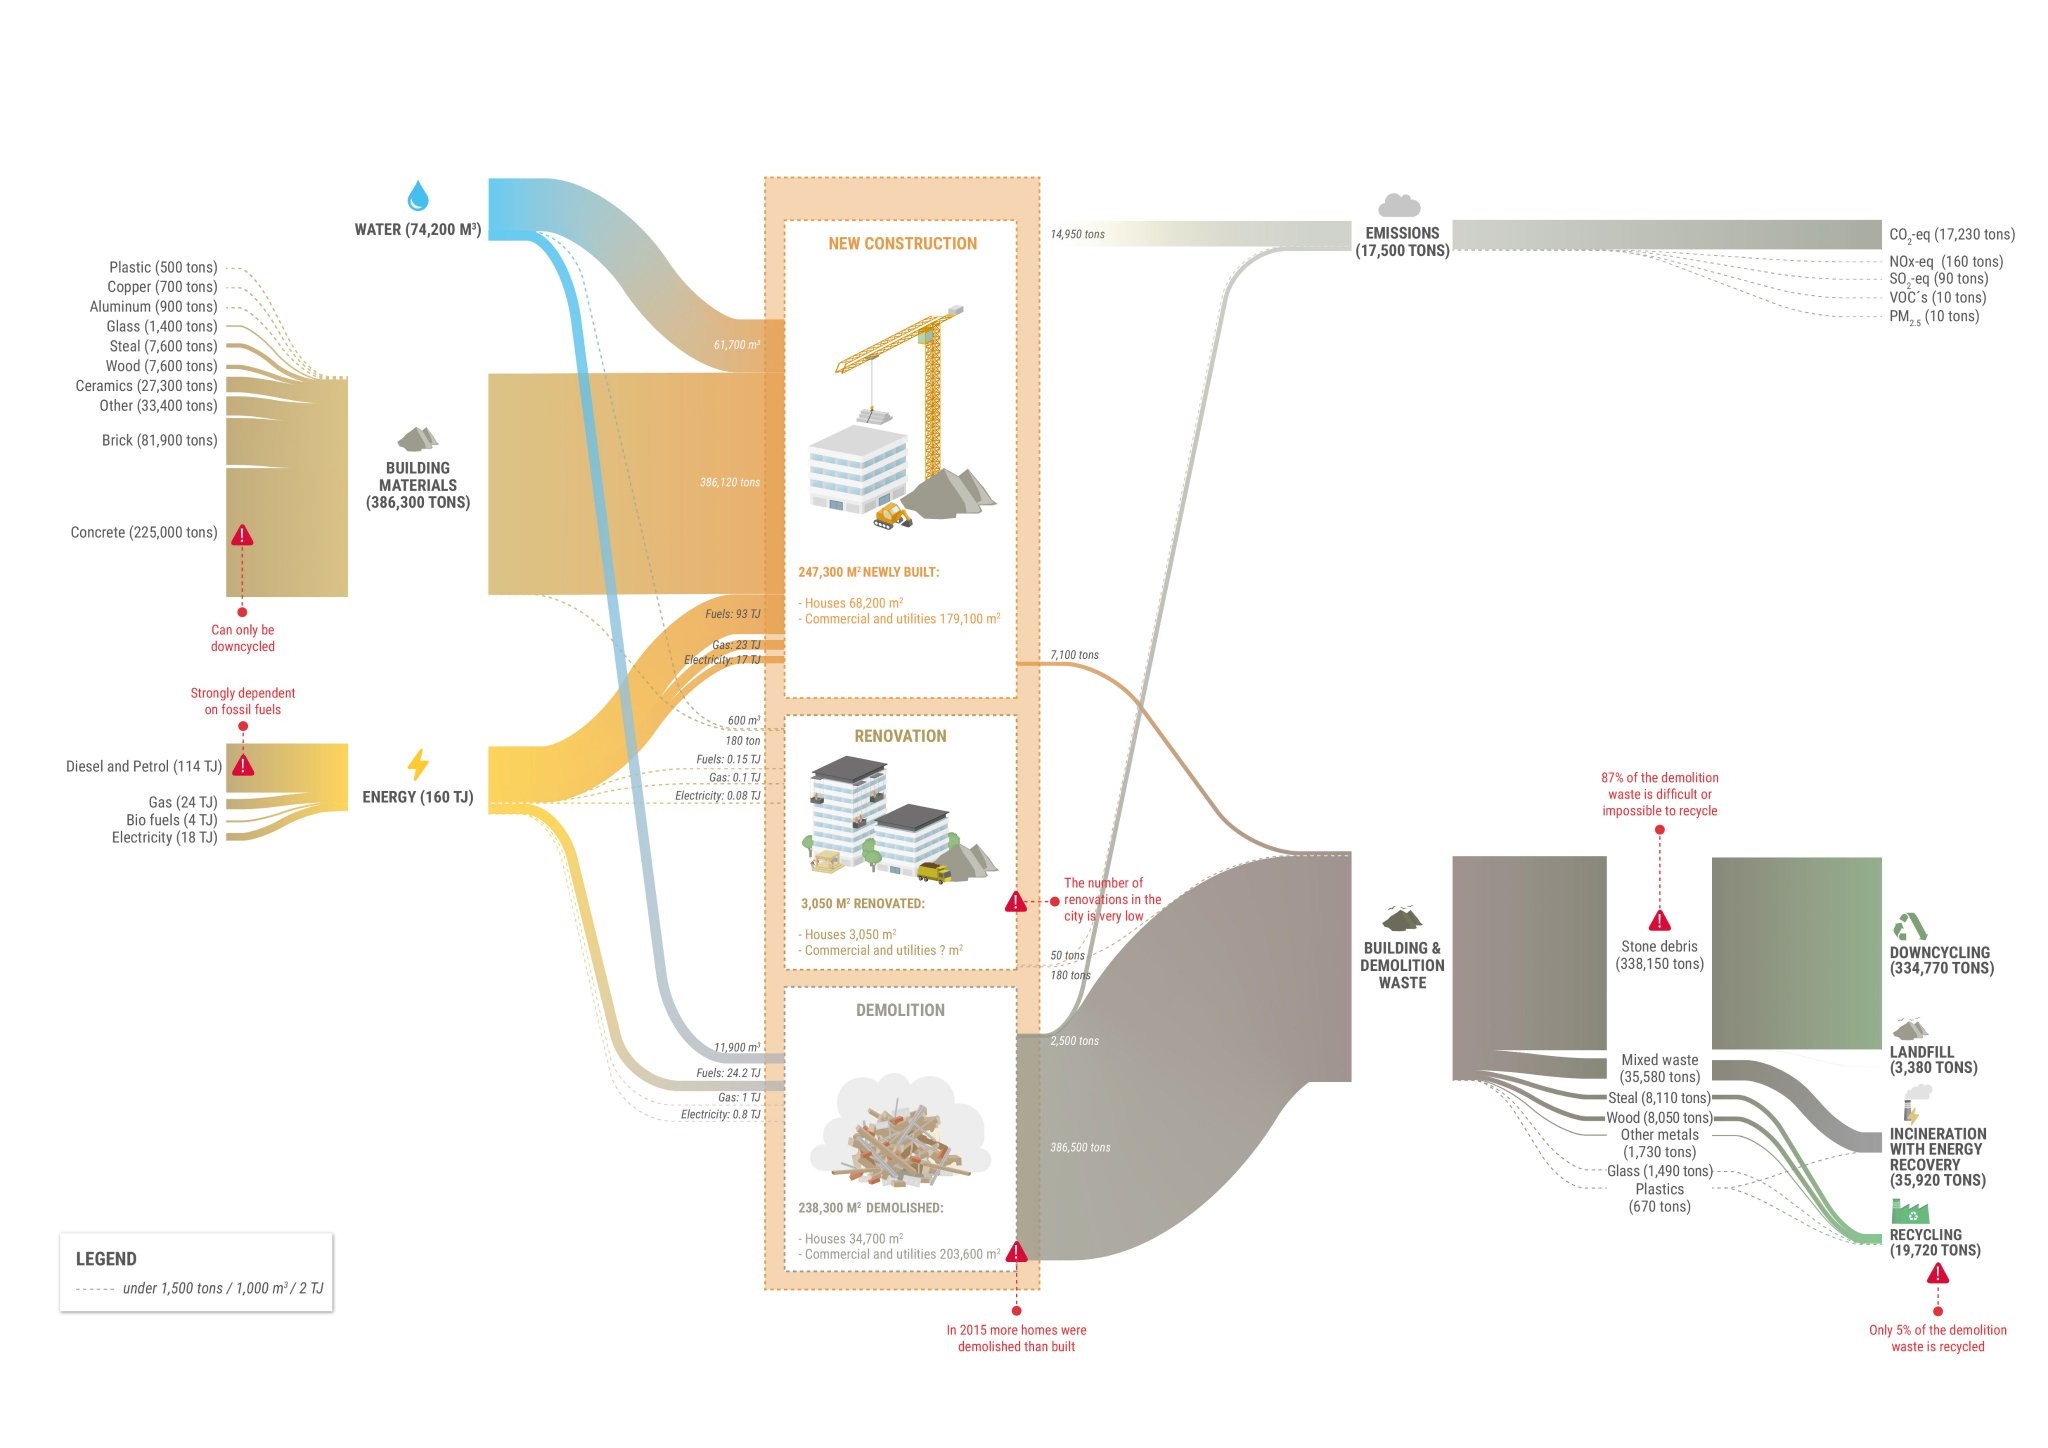
This infographic shows material flows (construction materials, demolition waste) in tons and energy in TJ. Flows relate to the construction sector in Rotterdam in the year 2015. This was originally produced by Metabolic for the report ‘Circular Rotterdam’.

The authors say. “This Sankey diagram on Rotterdam’s construction sector serves as a strong example of a data visualization for sustainability. It gives municipal authorities and industry stakeholders a clear idea of where they need to intervene – emissions generated largely in construction, material waste largely in demolition. Potential intervention points are highlighted in red; from reducing dependence on fossil fuels in construction to ensuring buildings are designed for renovation or disassembly rather than demolition.”

Hong Kong Water Flows

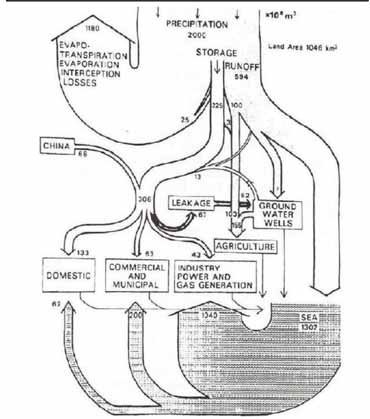
Sometimes I get a little nostalgic… Here is a Sankey diagram of water flows in Hong Kong. My guess is that it pre-dates 1997, so this would be the former British colony Hong Kong. Originally published in Worldbank’s Eco2 Cities book (Hiroaki Suzuki, Arish Dastur, Sebastian Moffatt, Nanae Yabuki and Hinako Maruyama. Eco2 Cities: Ecological Cities as Economic Cities. 2010), it is pictured in this guide(link currently broken) on page 41.


Flows of water are shown in 1.000.000 m³ of water (difficult to see, but I read this as 10 to the power of 6). Obviously hand drawn, so flows are not fully to scale.

Hongkong receives an average 2.000 Mm³ of precipitation (per year?) on a land area of 1.046 km² (interesting: todays area is 1.108 km²). Most of the water directly evaporates, and a large chunk goes into the sea.

This is considered an early example of a material flow analysis (MFA) visualization, and also of an urban metabolism study.

Cape Town Water Use Sankey Diagram

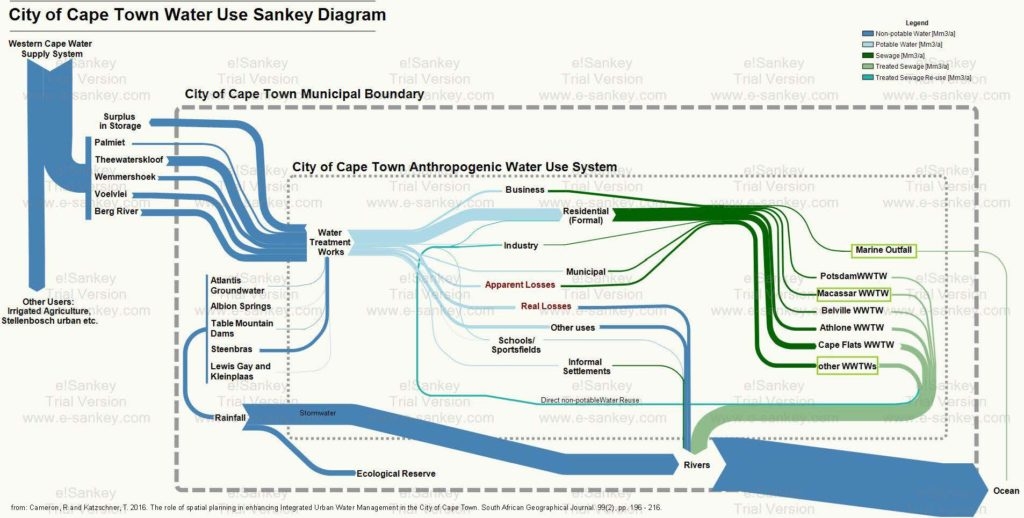
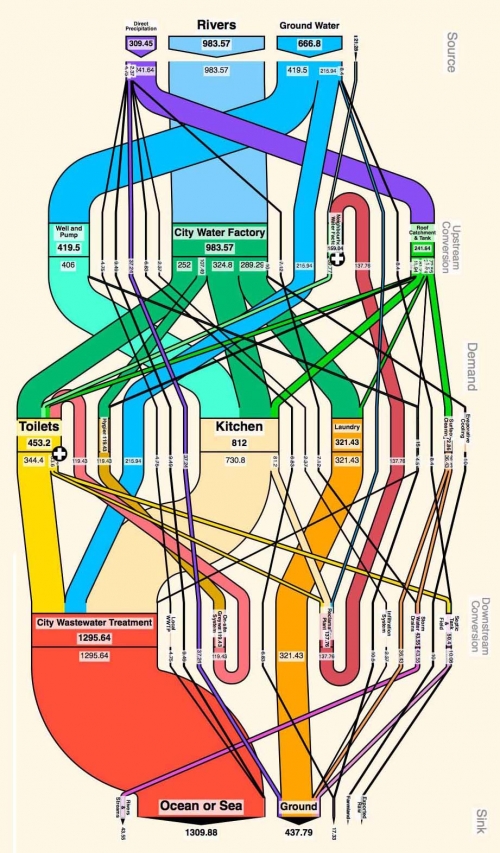
From a post ‘Cape Town’s water crisis : Towards a more water secure future’ on the Future Cape Town blog comes this Sankey diagram on the water use in the city of Cape Town (South Africa).

The author of the diagram, Rebecca Cameron, is with MCA Urban and Environmental Planners and looks at how Cape Town could transition towards a more water secure future. This Sankey diagram was originally published in her article Cameron, R and Katzschner, T. 2016. The role of spatial planning in enhancing Integrated Urban Water Management in the City of Cape Town. South African Geographical Journal. 99(2), pp. 196 – 216.

Absolute flow values are not given in this version of the Sankey diagram. Flows are in million cubic metres per year (Mm³/a). Water from five different sources outside the municipality feed the city of Cape Town, as well as five sources within the city. A breakdown of water supplied by the municipal water works is shown. Additional color coding of the arows indicate water quality (dark green = sewage, light green = treated water).

The author explains:

“This diagram is helpful in that it places all aspects of the water system in to one diagram. Here, water supply, water use, wastewater treatment and stormwater have been considered as a single system where too often the urban water cycle is fragmented when addressed within different sectors. The arrows of flow follow a key to represent the quantity and quality of water. The size of the arrow of flow is proportionally indicative of the quantity of water that flows from one process to one another. The colour of the arrows indicates the quality of the water flow; this includes non-potable, potable, sewage, treated sewage, and treated sewage for reuse. This is important to represent as, to intervene in an urban water cycle, both quantity and quality of water must be considered and used appropriately to move towards a more efficient and sustainable water system.”

From the rivers most of the water goes to the ocean. Through evaporation and precipiation it (hopefully) replenishes the reservoirs again that feed the city (this last part not shown in the diagram).
Stuttgart City Energy Flows

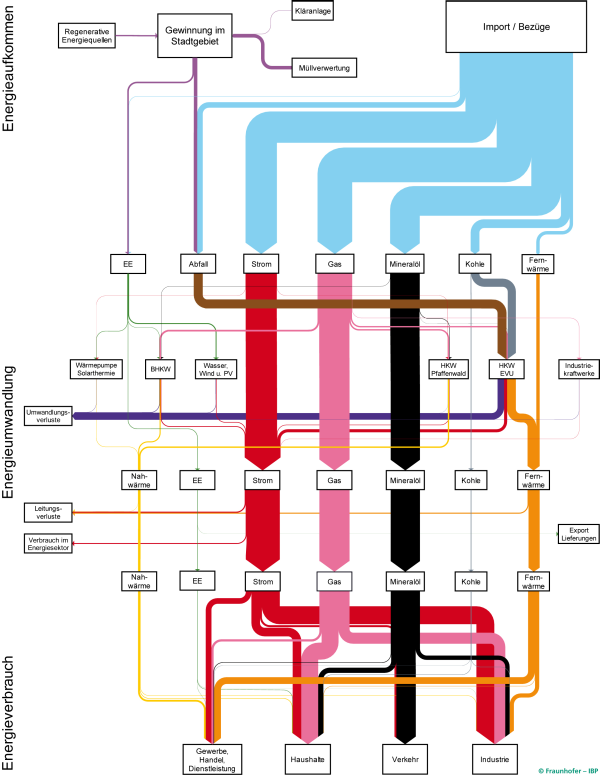
The energy balance of the German city of Stuttgart has been mapped as a Sankey diagram.

This was part of the project ‘SEE Stuttgart’ (City with Energy Efficiency / “Stadt mit Energie-Effizienz”) and has been developed by Fraunhofer IBP research institute.

A vertical layout was chosen. Absolute energy flow quantities are not shown in this version of the diagram, but are available in the underlying study. In 2010 primary energy consumption in Stuttgart was 20.300 GWh.

The diagram is used to promote a better understanding of the consuming sectors in the city, and the types of energy used. The SEE project aims to reduce Stuttgart’s energy consumption by 20% in 10 years and to transition to non-fossil fuels.

Stuttgart has actually won a first prize in a competition for energy efficient cities in 2016. It is thus setting a benchmark for other German cities. The above Sankey diagram is featured in this promotional video (in German) [at 2:36] and also briefly in this video (in German) [at 0:48] by IBP Fraunhofer.

A high resolution version of the Sankey diagram can be found here.

Amsterdam Energy System Visualized

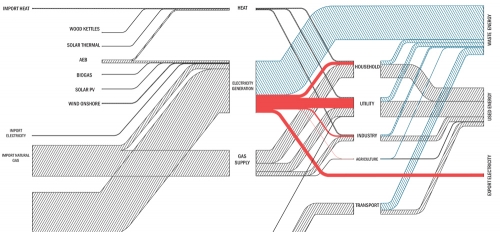
Tom Van Heeswijk and Changsoon Choi, landscape architecture master students at Wageningen University in the Netherlands have created the below “preliminary Sankey diagram of the Amsterdam energy system”. This is part of the larger project URBAN PULSE described on the research page of the NRG lab website.

Only the top part of a larger Sankey diagram is seen here, the bottom part with fossil fuels apparently cropped. No units or figures shown, so just a schematic visualization.

Nevertheless some interesting features: in contrast to many other Sankey diagrams, nodes are not depicted with outlines but shown as gaps with their name. Electricity is highlighted as red bands while all other flows have a single-hatching fill pattern.

Beauty of simplicity…

Participatory Urban Metabolism Information System

Interesting project described in the blog article ‘Understanding your city by understanding its flow: towards Participatory Urban Metabolism Information Systems’ by Sven Eberlein of the Ecocitizen Worldmap Project.

This is a participatory approach where young citizens track the water flows in their city in a crowd-mapping approach. The data is visualized as Sankey diagram (here called MetaFlow diagram). Pilots were carried out in Casablanca and Cairo.

This project is somehow linked to Sebastian Moffat’s activities I have featured in a blog post back in 2008.

This seems to be the result from either the Casablanca or the Cairo field work. Great colorful Sankey flow diagrams. Judging from the photos in the blog post, working with the local community seems to have been fun. The participatory approach is emphasized (Sven calls this a ‘Participatory Urban Metabolism Information System (PUMIS)’).

More Sankey diagrams can be seen in the original blog post.