Tag: France

France’s Grand Est Region Energy Flows

Le Grand Est is a French administrative region in the north-east of the Hexagone, comprising Alsace, Champagne-Ardenne, and Lorraine. ATMO Grand Est is a not-for-profit, government-backed association that is monitoring air quality in the region and looking at ways to improve it.

As part of their work they have prepared energy flow diagrams, not only for the whole region, but also on the communal level. More than 100 Sankey diagrams, depicting the energy flows and the use of energy are available on the ATMO website. Visit the resources section and check “Diagrammes de Sankey” in the filter list at the right.

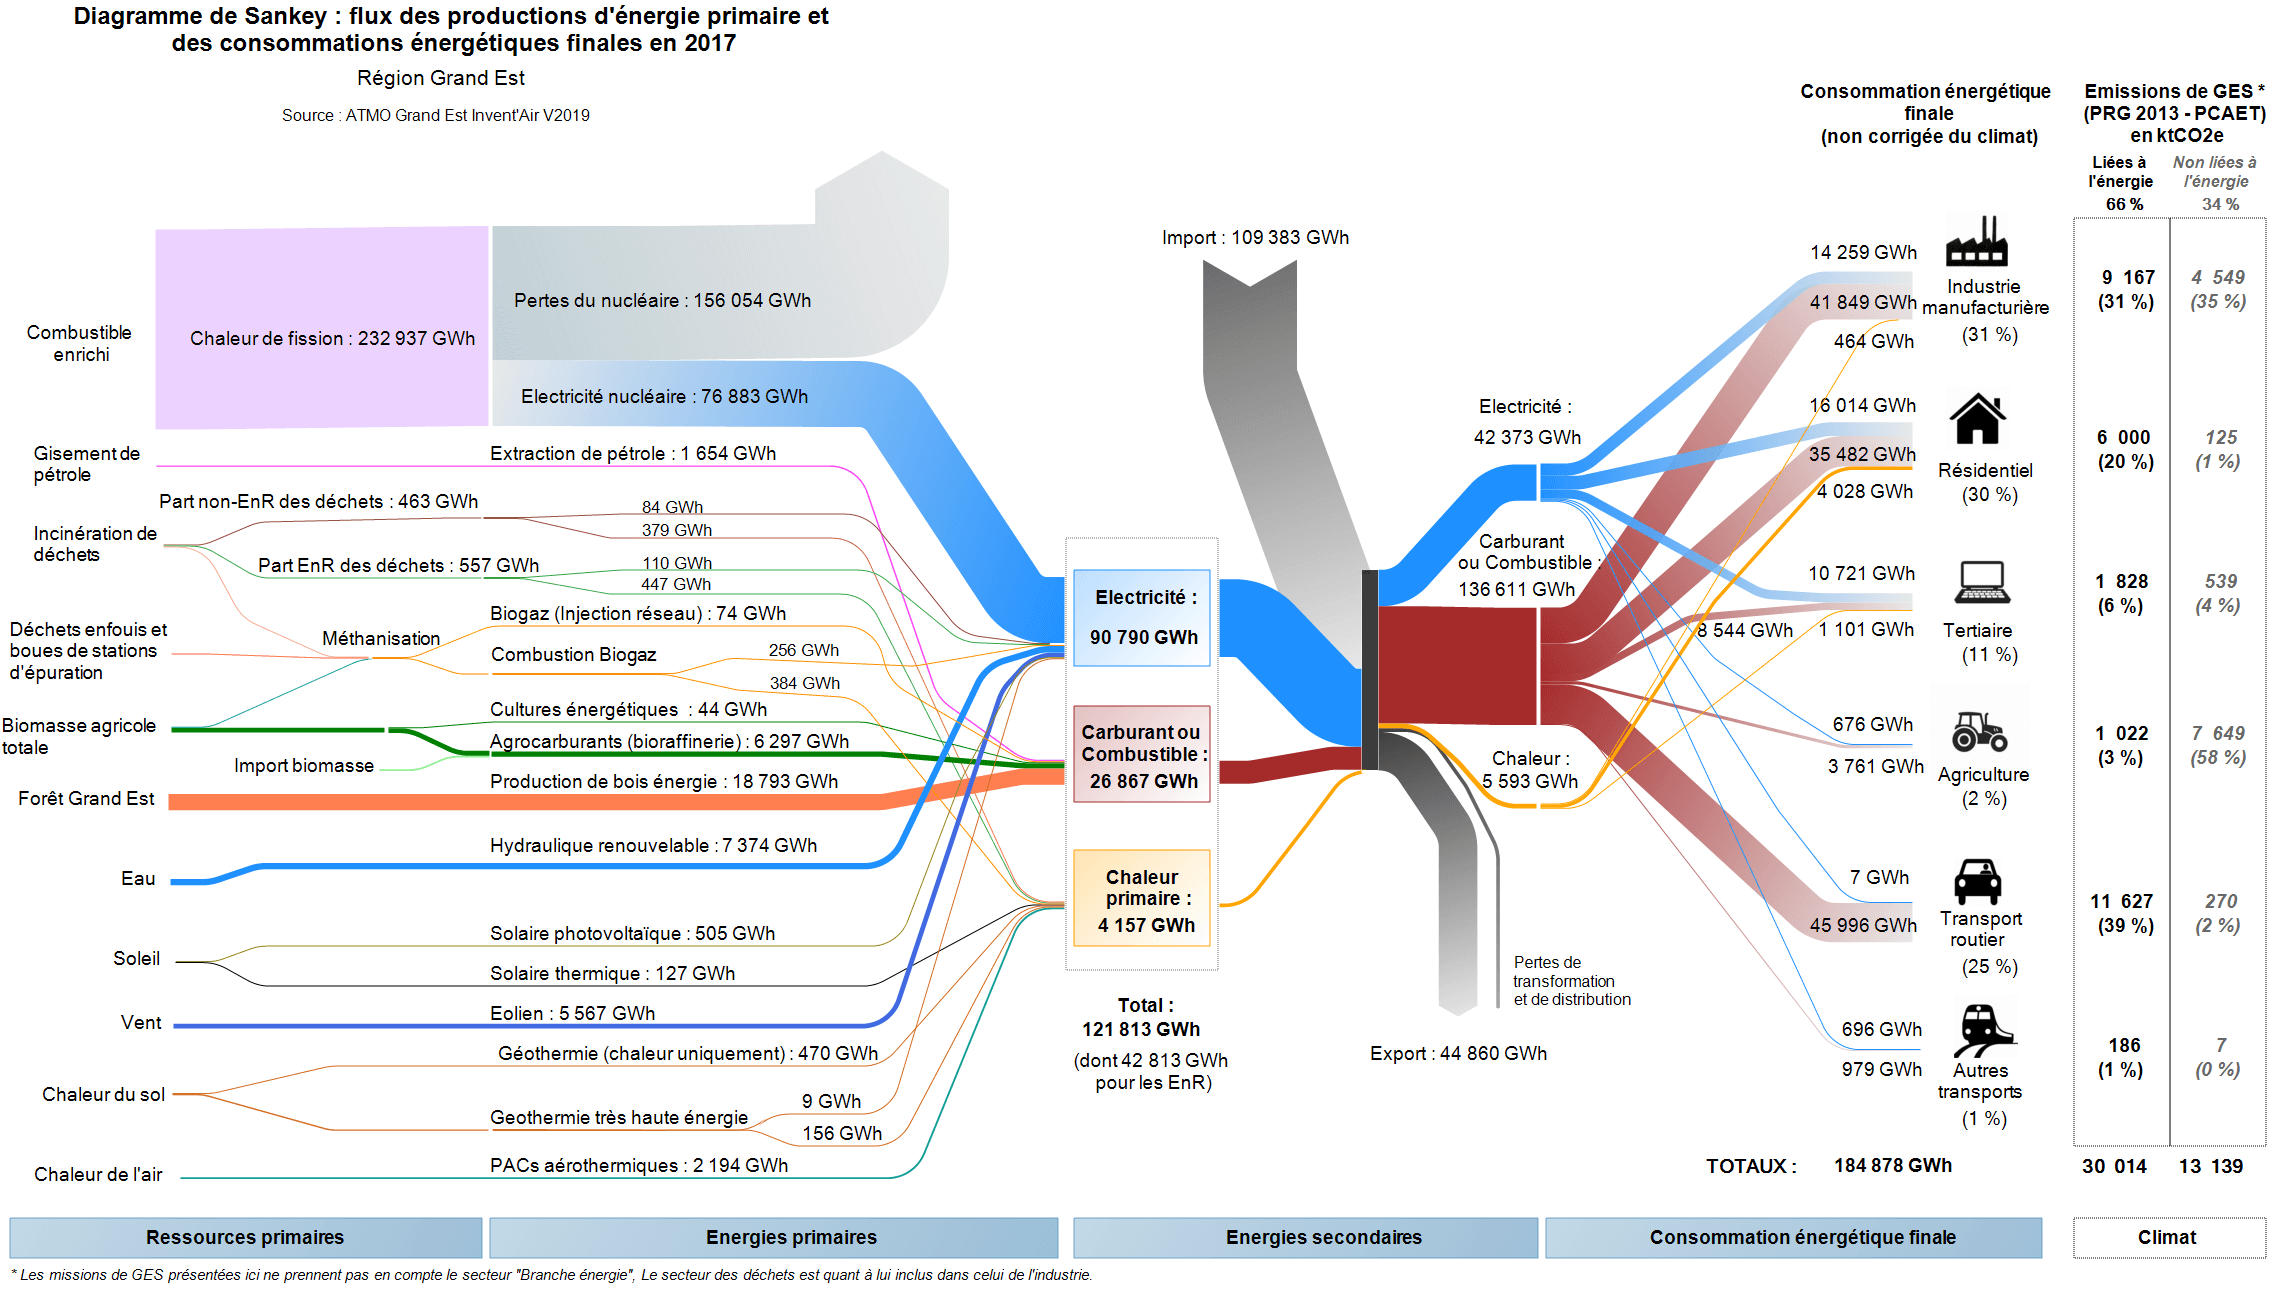
Here is the figure for the overall region with energy consumption and use in Grand Est in 2017. Flows are in GWh.


On the left we see primary resources, with the largest source being nuclear fuel. With an efficiency of only 33% this still delivers most of the secondary energy consumed in the Grand Est region. The grey stream from the top are “imports” to the region, most likely from other parts of France (or from neighboring Germany). The energy consuming sectors are shown on the right. A table next to them points out the GHG emissions linked to the energy.

Each of the individual Sankey diagrams for the CCs (communauté de communes, rural communities) and some CAs (communauté d’agglomération, semi-urban communities) available have exactly the same structure, but they can look strikingly different.

Here is one example from CC Portes de Meuse, a community with just over 17,000 inhabitants


CC Portes de Meuse can apparently cover three-quarters of their energy demand from wind and wood, with only 25% being imported. (Not sure though how they can have 260 GWh energy use in road transport, unless most vehicles are already electric).

Note that although both Sankey diagrams have a similar structure and flows are both in GWh in 2017, this diagram mustn’t be compared directly to the one above in regard to the width of the arrows, since they are on a different scale.

Great work by ATMO Grand Est, and I am sure these visualizations are useful when discussing energy consumption, GHG and air pollution among stakeholders in the communities or the region. They have already announced the Invent’AIR v2020 version to be published in the near future.
Energy Balance La Réunion 2018

Two years ago I posted an early version of the energy balance for the French overseas region La Réunion, an island in the Indian Ocean. Visiting the website of Horizon Réunion (formerly Energies Réunion) now, I am happy to see that they have taken the elaboration of the energy balance much further, and are now publishing this detailed Sankey diagram for energy flows in 2018.

The diagram has been created by Observatoire Énergie Réunion (OER). Flows are in ktoe (ktep, kilo tonne d’équivalent pétrole in French). Overall primary energy for the island was 1441.8 ktep, of which 87% is fossil and 13% from renewable sources. We can see that mobility is the largest chunk of energy use with 64.5%.

You can access the full report with all background data here.

WEEE in Midi-Pyrénées

From what I know, France’s approach to tackling energy and waste issues is to break the topic down to the regional level, and to involve local stakeholders.

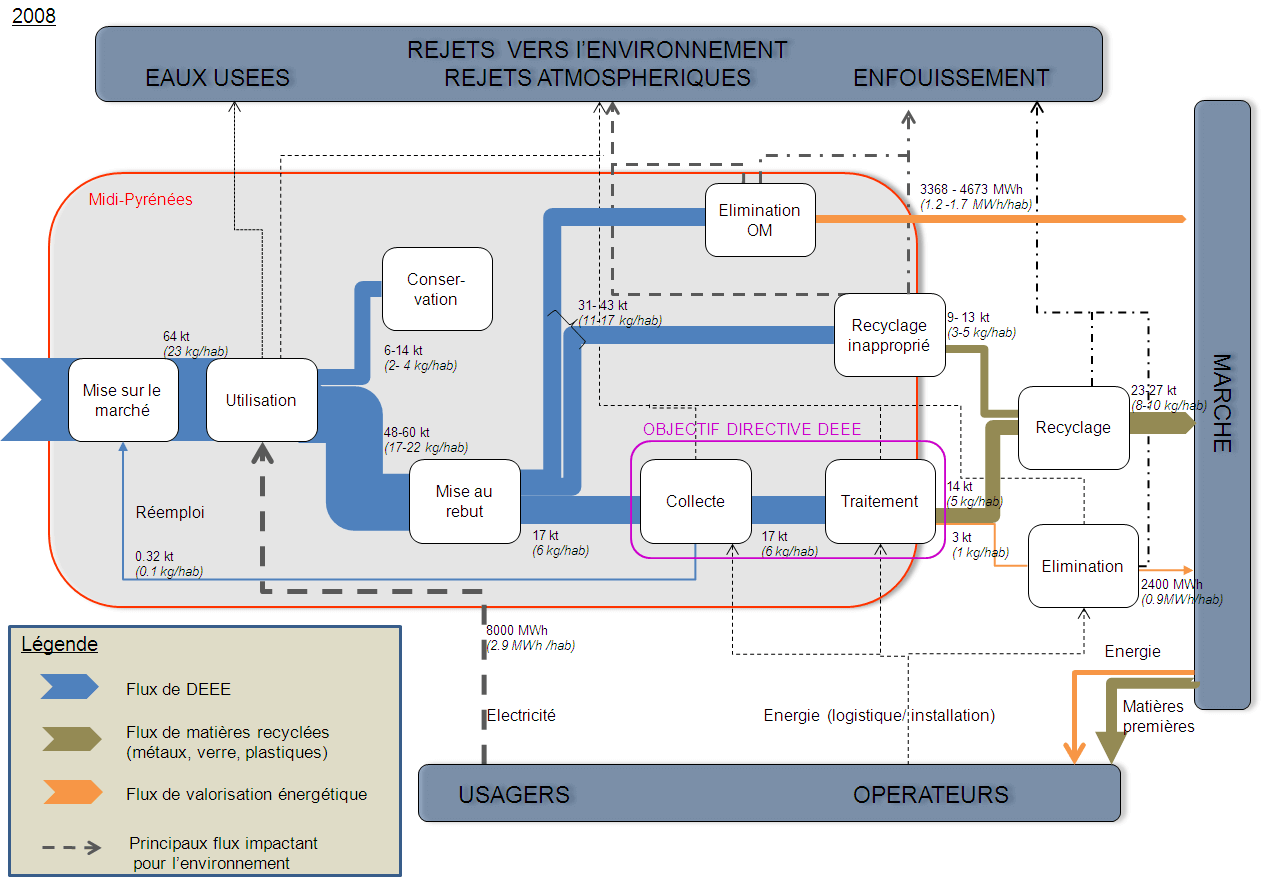
Here is an article on ‘Métabolisme territorial et filières de récupération-recyclage: le cas des déchets d’équipements électriques et électroniques (DEEE) en Midi-Pyrénées’ by Jean-Baptiste Bahers that was published in the journal Développement Durable et Territoires. Vol. 5, n°1 in February 2014.

It discusses the ‘Territorial metabolism and recovery-recycling chain: the example of Waste Electrical and Electronic Equipment (WEEE) in the “Midi-Pyrénées” region and has the following Sankey diagram figure.


Licensed under CC BY-NC 4.0

WEEE waste streams are in kilo tonnes (kt) in the year 2008. Additionally, recovered energy from waste treatment is shown (in MWh) with orange arrows. The red line delimits the region, so apparently the electronics waste recycling and disposal (élimination) takes place outside the Midi-Pyrénées region. Some flows are labeled with a range (e.g. 6-14 kt), which is obviously difficult to draw as Sankey arrow. My guess is that the median value was used to determine the actual width of the affected arrows. A nice feature are the per capita values (e.g. 2-4 kg/hab), which makes it much easier to grasp and to relate to for the indivdual person living in Midi-Pyrénées.

Wood Flows in Auvergne Rhône-Alpes

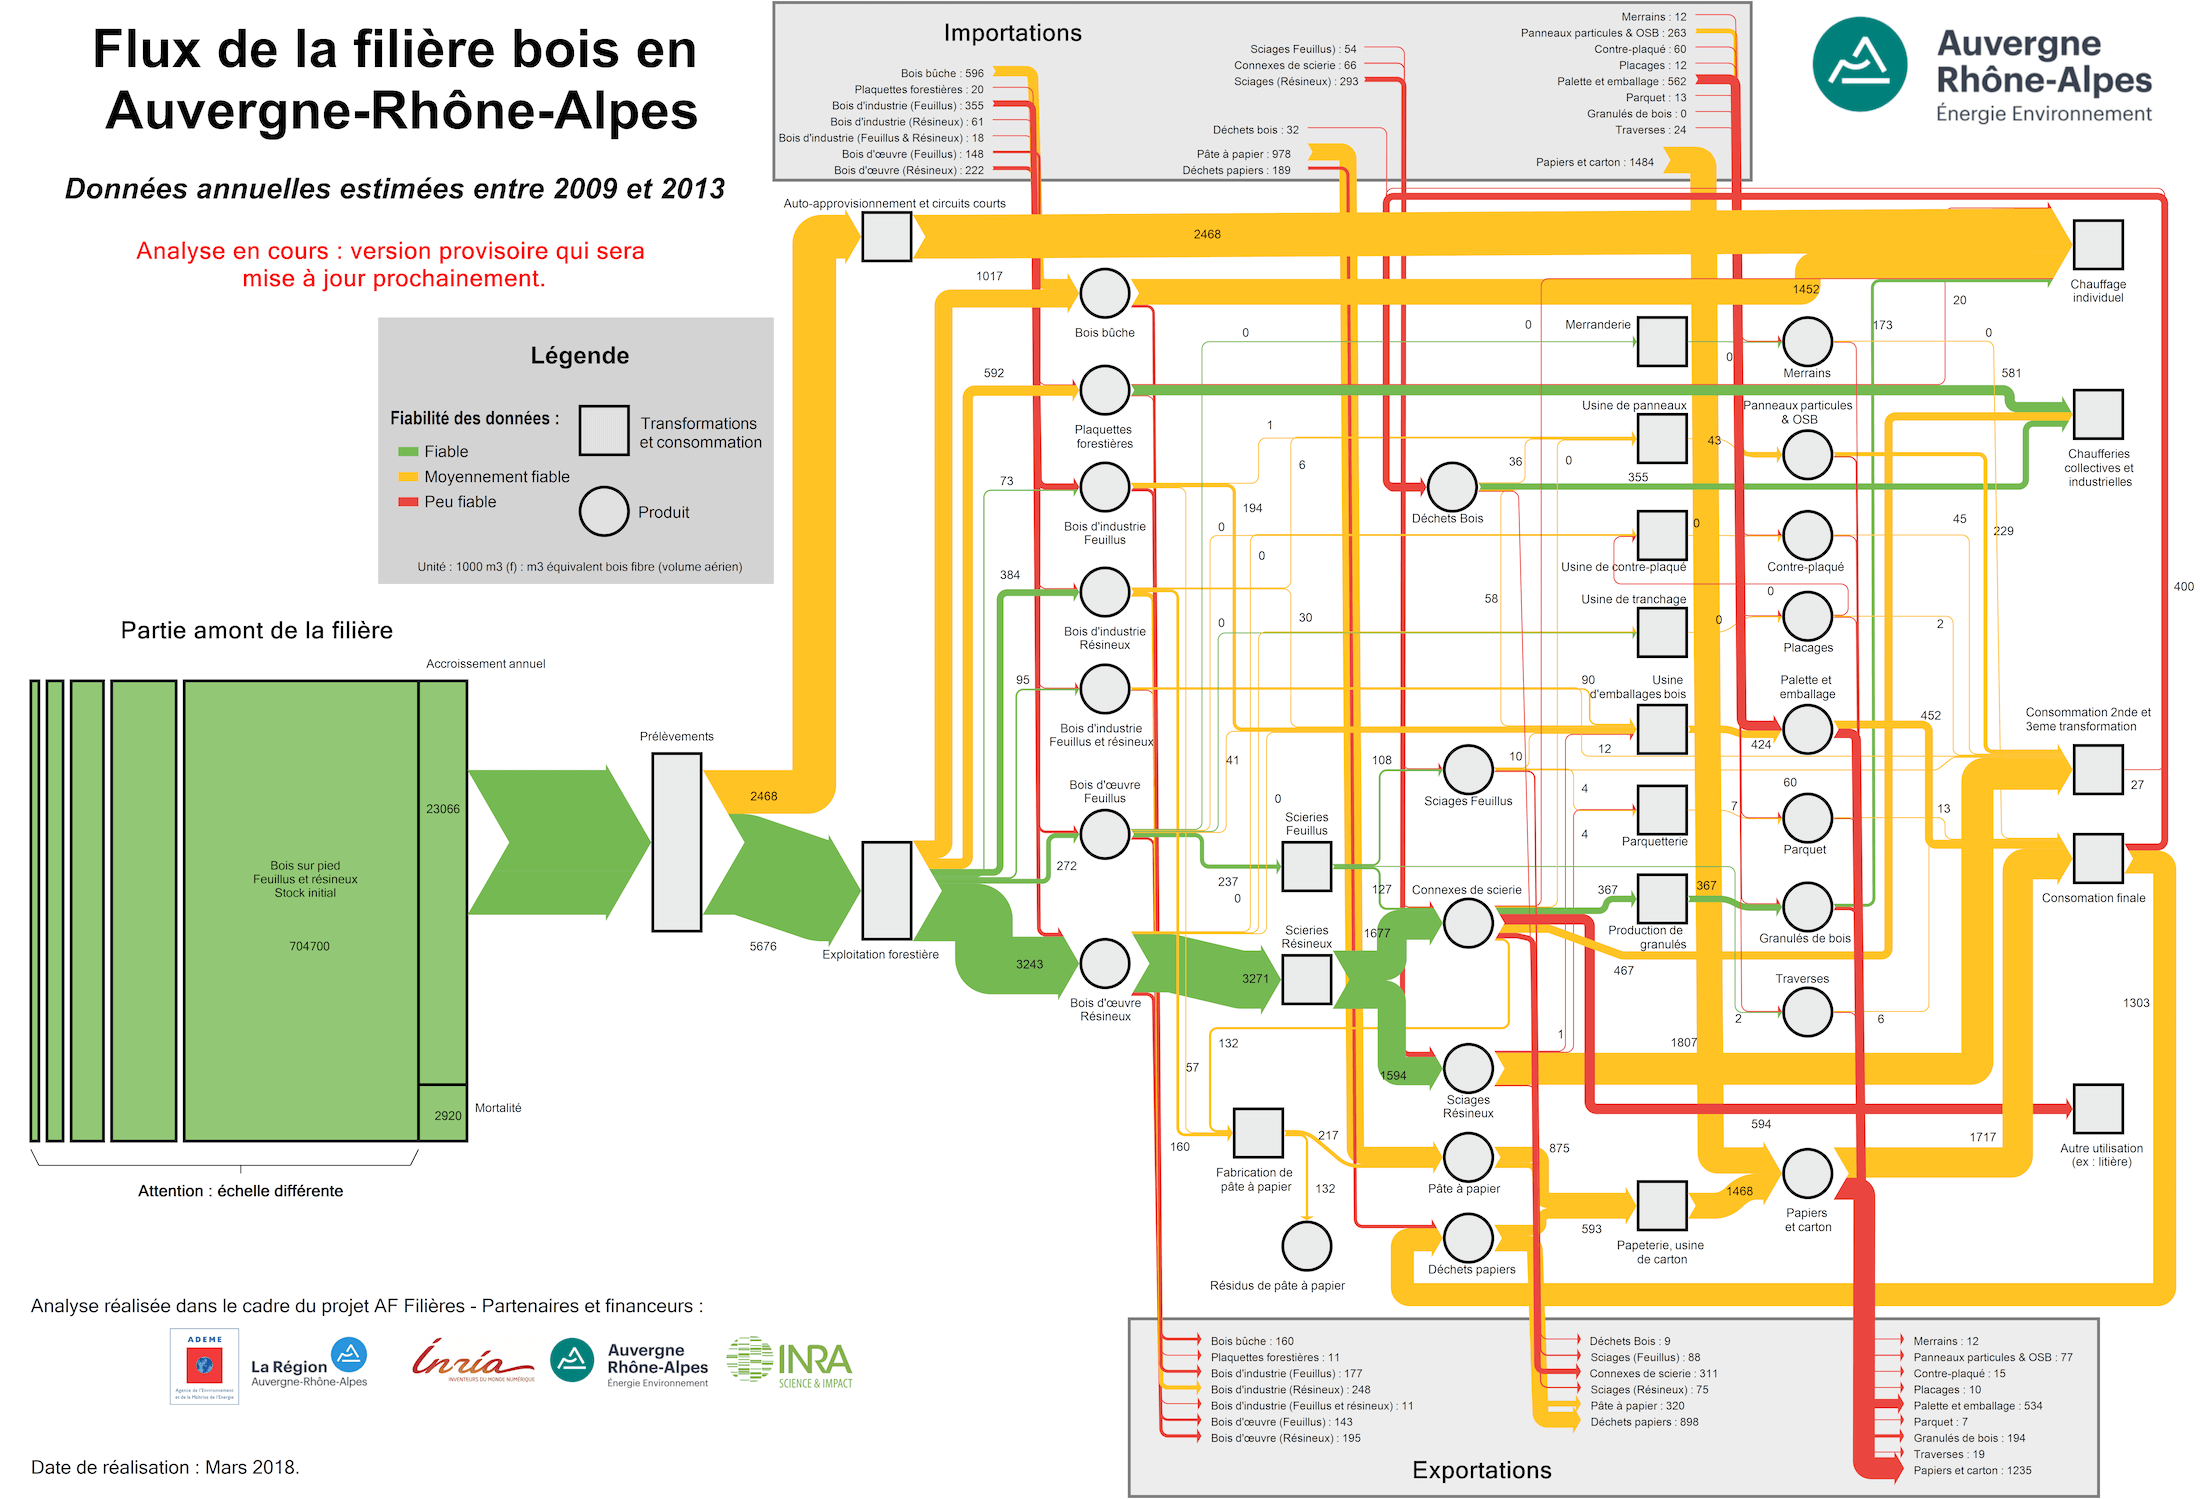
Following up to my post on energy flows from biomass in the Auvergne Rhône-Alpes region, here is another great Sankey diagram on wood flows by Auvergne-Rhône-Alpes Énergie Environnement (AUR-EE) agency.


Flows are in 1,000 m³ (f) wood fibre equivalents (read more about this unit here). The annual average of the years 2009 to 2013 in the region is visualized.

Wood is used for energy generation (top part), wood products (middle section), and pulp & paper (bottom part). Imports of wood or wood-based products come in from the grey box at the top, and export streams leave to the bottom grey box. Import and export in this case is from/to the area outside the Auvergne Rhône-Alpes region.

The green box on the left represents the existing standing wood stock (estimated at 704,700 thousand m³ wood fibre equivalents), which has an annual increase of 23,066 m³ (f) on average. Only 8,144 m³ (f) are removed from the forests per year.

The color coding relates to the data reliability (fiabilité des données): Green flows are based on reliable data, while yellow is for medium reliability and red for less reliable.

Biogas in Auvergne-Rhône-Alpes region

The French region Auvergne-Rhône-Alpes in the south-east of the Hexagone borders with Switzerland and Italy. Lyon and Grenoble are located in this region, known for skiing, lush pastures … and great cheese!

Auvergne-Rhône-Alpes Énergie Environnement (AUR-EE) is a regional agency that works to bring together players in the renewable energy field and to promote RE projects.

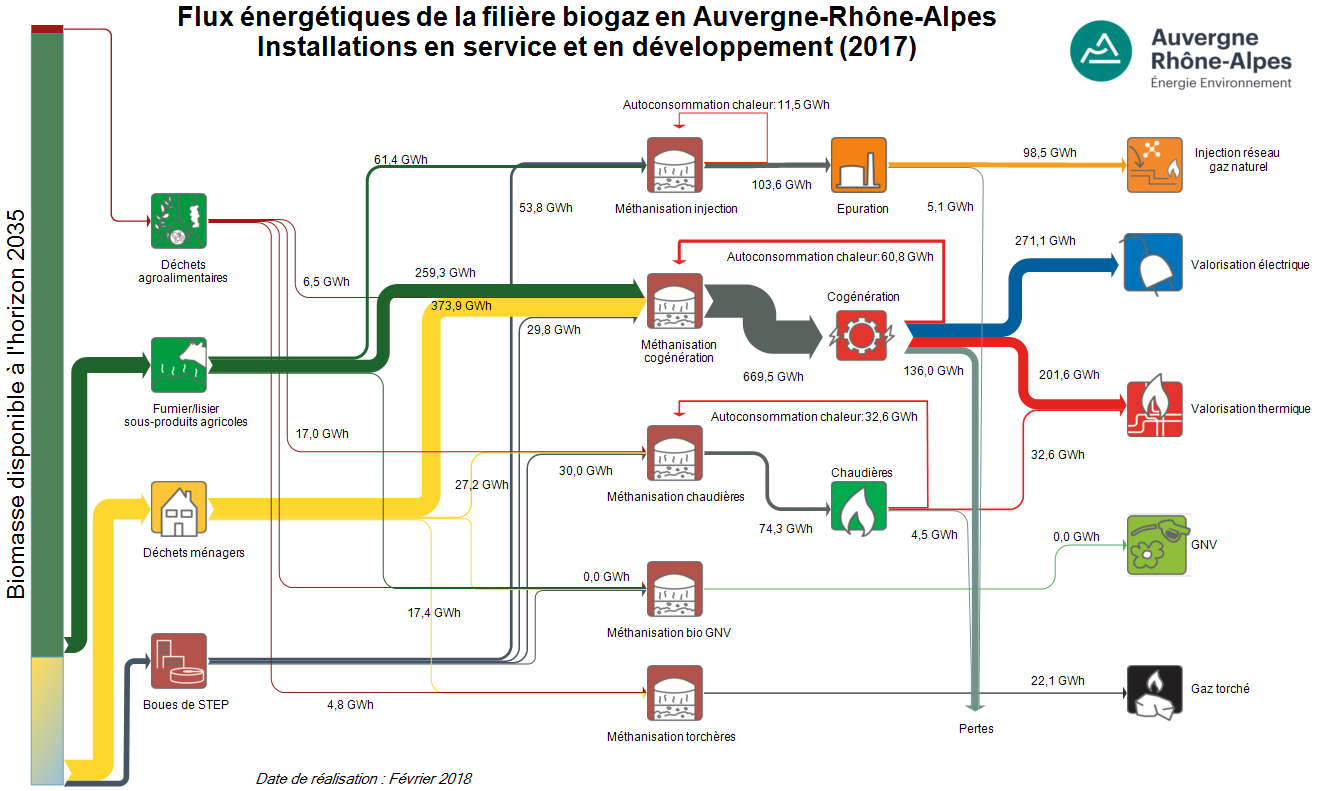
Given the agricultural character of Auvergne-Rhône-Alpes, biomass use for energy generation has been going strong in recent years. The agency has created energy flow Sankey diagrams for existing biogas installations, as well as a projection for the ones being under development.

Data is for 2017 and for the scenario where all projects currently under development would already completed. The yellow stream (‘déchets ménagers’) is household waste, providing 374 GWh of energy. Manure and other side-products from agriculture (green arrow) contributes another 260 GWh.
The stacked bar on the left hand side of the diagram indicates the potential availability of biomass by 2035, and one can see that only a small fraction of it is currently being taken advantage of.
Biogas is produced in anaerobic digesters (‘méthanisation’) and the region yields some 271 GWh electricity and 200 GWh heat per year from cogeneration plants. Already almost 100 GWh of biogas could be injected to the natural gas network, allowing for storage of the energy.

Note that smaller or even negligible flows are still shown with a minimum width in order to make them visible (these thinner arrows are not to scale with the others).

Réunion Island Energy Sankey

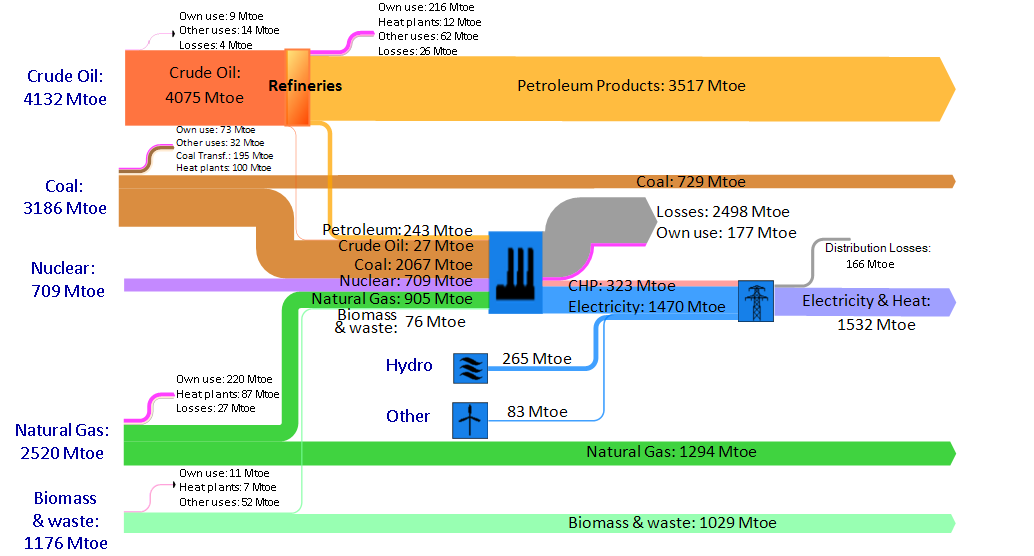
This Sankey diagram visualizing the energy balance for the French island Réunion has already been published back in 2010 in an article on reliability of supply in future power systems. (Mathilde Drouineau, Nadia Maïzi, Vincent Mazauric, Edi Assoumou. Long term planning tools and reliability needs: focusing on the Reunion Island. 3rd IAEE Rio 2010 International Conference “The Future of Energy: Global Challenges, Diverse Solutions”, Jun 2010, Rio de Janeiro, Brazil. 14 p., 2010). Access article here.

The flows are in Mtoe for the year 2007. The authors have been using the Markal/TIMES models to obtain data and study alternatives for future energy scenarios for the Réunion Island.

Landscapes of Climate Finance, I4CE

What is landscape of climate finance? A paper published December 2016 by I4CE tells us that “Landscapes of climate finance are comprehensive studies mapping financial flows dedicated to climate change action and the energy transition. Covering both end-investment and supporting financial flows from public and private stakeholders, [they] draw the picture of how the financial value chain links sources, intermediaries, project managers and the end investment.”

The paper by Hadrian Hainaut (I4CE), Andreas Barkman (EEA) and Ian Cochran (I4CE) titled ‘Landscapes of domestic climate finance in Europe: Supporting and improving climate and energy policies for a low-carbon, resilient economy’ features two interesting Sankey diagrams.

This is the ‘Landscape of Climate Finance in France 2014’:


Flows are in billion Euro. Sources and receiving sectors indicated with distinctive black boxes. The authors opted for strictly horizontal/vertical arrow routing. There are no individual quantities at each arrow, so the actual numbers can only be estimated from the arrow proportions.

This is the ‘National Climate Finance in Belgium 2013’:


Flows are in million Euros. Some muddle here at the exit of the top light blue box where the arrows overlap instead of showing the sum of roughly 2000 m€ spending. This coincides with three overemphasized arrow heads for the arrows leading to “Public Investments”, “Policy Incentives” and “Grants”. Arriving arrows at the box “Climate Mitigation” overlap and the Sankey diagram could benefit from clearing up here.

Not sure about the ESDC voting: “France: huit points, La Belgique: dix points” maybe 😉

I had reported on climate finance diagrams back in 2014 when the concept was first presented by Climate Policy Initaitive (CPI) but had since lost sight of them. I am happy to see that the idea is still alive and being taken up in a number of countries in Europe. Also good to see that the diagrams are not yet regulated by a standard and there is some “diversity” among these diagrams.

Regional Energy Flows Nouvelle-Aquitaine

Nouvelle-Aquitaine is a region in the southwest of France, with Bordeaux being its capital.

France, despite being a rather centralized, Paris-focused country relies on a decentralized approach for sustainable development, greenhouse gas (GHG) emissions reductions and energy saving. Thirteen so-called ‘regional energy agencies’ have been founded since 1995 engaging with regional actors and local communities. AREC (Agence Régionale d’Évaluation Environnement et Climat) is the environment and climate agency for the Nouvelle-Aquitaine region.

Many publications on energy and climate change are available on their website. Below is a Sankey diagram depicting the regional energy balance for Nouvelle-Aquitaine (Source: ‘Profil énergie et gaz à effet de serre en Nouvelle-Aquitaine – Année 2015 – Edition 2017’).

Flows are in GWh for 2015. Overall primary energy was 283.605 GWh, with 182.719 GWh final energy consumption. On the left side energy sources are split into imports (from outside Nouvelle-Aquitaine, 88%) and regionally produced energy, 12%). As is common in France, nuclear energy dominates the picture. On the right side we see the breakdown of energy consumption. The services sector (tertiary sector) is featured explicitly. It is responsible for 13% of Nouvelle-Aquitaine’s energy consumption, less than industry (19%) but more than agriculture (5%).

The Sankey diagram is very colorful and sports round icons. This goes well with the overall style of the report that targets explicitly at local communities and actors.