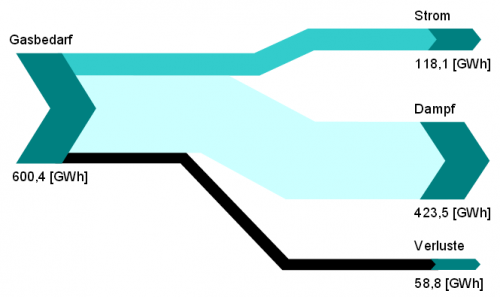
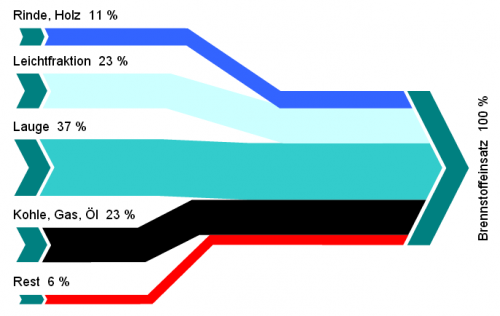
Most Sankey diagrams I find on the web are from Germany, Switzerland or Austria. Anybody in the know, if this due to the visualization type being part of the engineering curriculae in these countries?
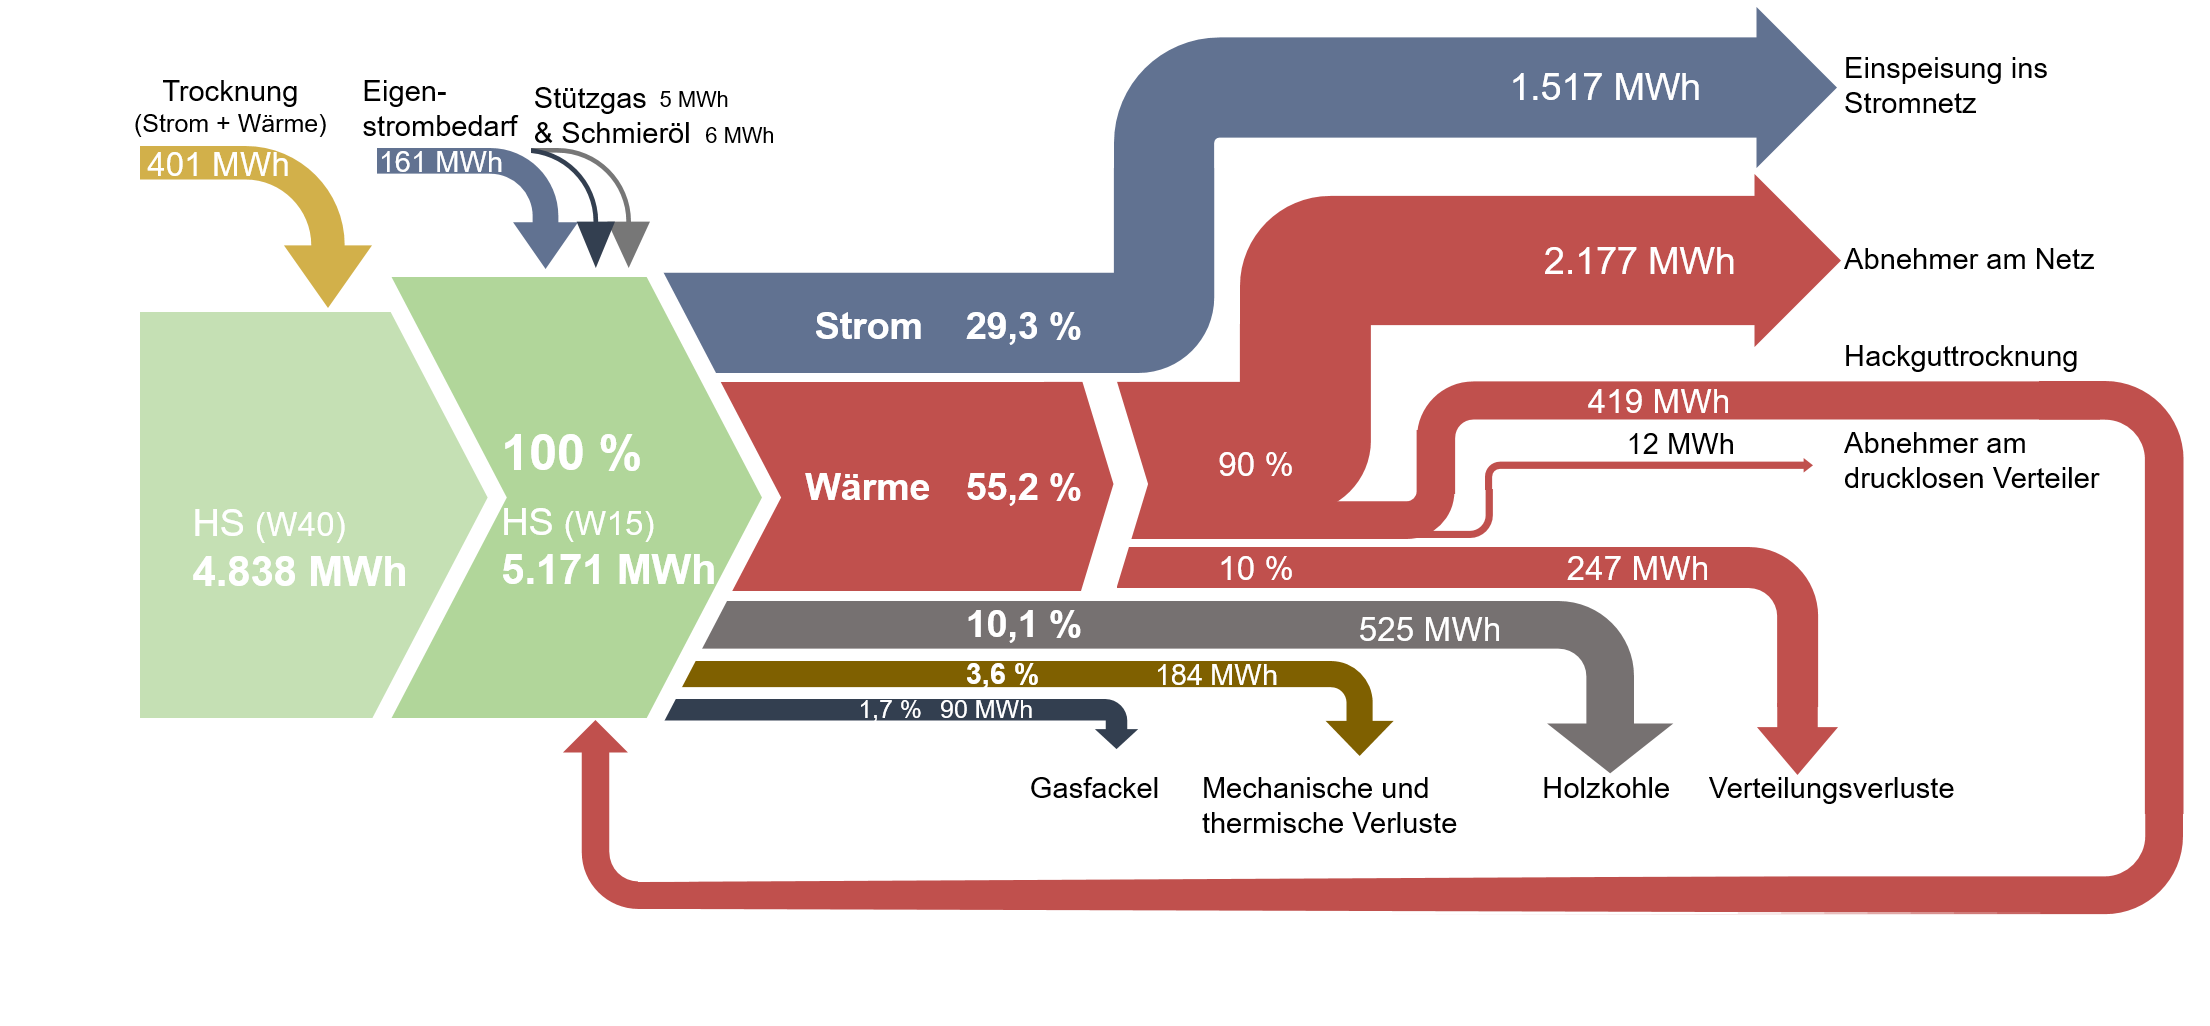
Here is one I found on ‘The Wood Power Plant’ blog by Austrian firm Syntec. It is originally taken from a student master thesis on ‘Life Cycle Analysis of Electricity and Heat Generation of a Wood Gasification Plant including District Heating Network’ (German title: ‘Lebenszyklusanalyse der Strom- und Wärmeerzeugung einer Holzvergasungsanlage inklusive Nahwärmenetz’, thanks Google Translate – you are my friend!) by Elena Käppler of University of Applied Sciences Vorarlberg.
While being graphically quite appealing there are some issue with this Sankey diagram. Flows don’t seem to add up correctly: for example the main stream 4.838 MWh and the 401 MWh coming in at the top would be larger than 5.171 MWh.
Also, some flows are not true to scale. Check out the red arrow representing 247 MWh (going down to ‘Verteilungsverluste’) and compare it to the red one going back in a loop, which represents 419 MWh (‘Hackguttrocknung’).
